What a complete deployment needs
The suite runs on a single Otoroshi with nothing else installed, and most of it keeps running that way. Two capabilities, however, are only as good as the infrastructure underneath them, and both fail in the same quiet direction: a page that shows nothing looks exactly like a page with nothing to show.
This is the page to read before trusting a number.
The short version
| Needs | Without it | |
|---|---|---|
| WAF, bots, reputation, honeypots, the preset | nothing | — |
| Cluster-wide bans, the allowlist, fail2ban, challenges, the ledger | a redis | Each node keeps its own; a threshold means N× what you configured on N nodes |
| Login guard counters, throttle quotas, object budgets | a redis | Each node counts its own: an attack spread over N nodes needs N× the threshold, a quota or a budget is N× what you set |
| API reports merged across nodes | a redis | Each node's inventory is reported by the node serving the report only |
| The traffic guard and the object guard's patterns | nothing | Per node by design: ratios to a baseline mean the same on one node as on twelve |
| Incidents merged across nodes, and their state | a redis | The console shows only what the node serving it saw |
| Tuning assistant candidates | a redis | On a leader/worker cluster, an empty page |
| Learning mode windows | a redis | Counts that never leave the workers |
| Dashboards and analytics queries | a postgres | No history, no volumes, no top-N |
| Route posture | nothing | — |
So: a redis for shared state, a postgres for analytics. Neither is required to evaluate a request; both are required to operate the thing.
The shared state, and the leader/worker trap
security {
  // guarantees distribution regardless of the otoroshi storage backend
  redis-uri = "redis://localhost:6379"
}
Without that setting the suite falls back to Otoroshi's own storage — and this is where the surprise is.
On an Otoroshi cluster in leader/worker mode, a worker never talks to your configured storage
backend at all. Otoroshi hands it a SwappableInMemoryDataStores whose contents are replaced from
the leader on every sync, and nothing under the :extensions: prefix is on the short list of keys
that survive a swap. So:
- workers serve the traffic, and record what they see into a store that is wiped seconds later;
- the leader serves the admin API, and reads its own store, which the workers never wrote to.
This holds whatever your storage backend is. A shared Postgres does not help, because the worker
is not reading it. Only a dedicated security.redis-uri puts every node on the same store.
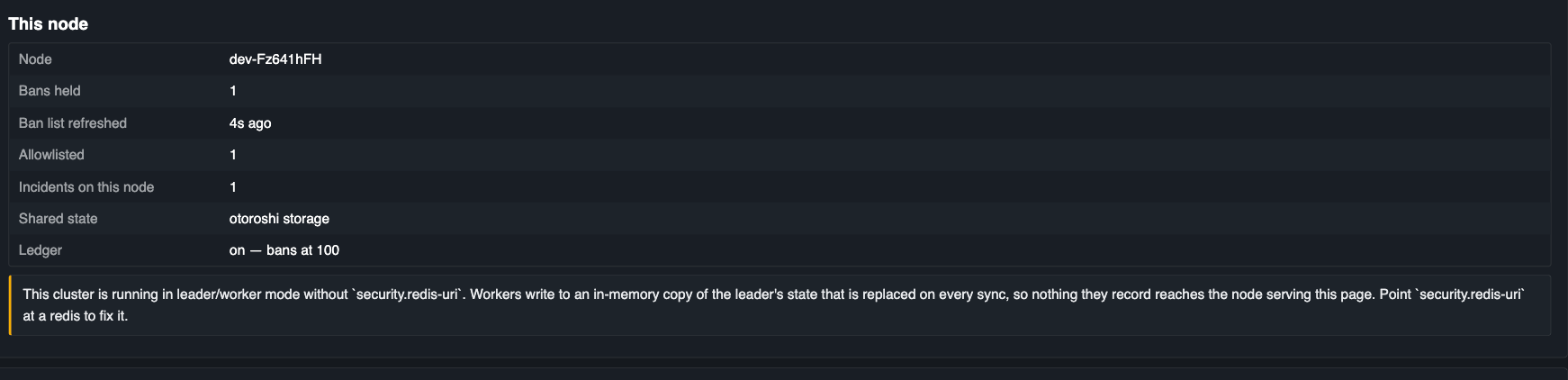
Shared state: otoroshi storage is the fallback. The line under it is the one to act on.
The tuning page and the learning report both say so. The tuning page prints "the shared state is not reaching the other nodes", and learning refuses to let its window be read as a measurement of your traffic. The Bans & incidents page reports which of the two stores is in use, and prints the reason it is not reaching the other nodes rather than leaving you to infer it from a short list.
If your cluster mode is off — several nodes each talking directly to a shared Postgres or Redis
storage — the fallback works, because every node reaches the same backend. The dedicated redis is
still the more predictable choice.
The analytics store
The security console reads events back through Otoroshi's user-analytics exporter, which writes to PostgreSQL:
{
  "type": "user-analytics",
  "config": { "uri": "postgresql://user:pass@host:5432/otoroshi" }
}
The suite declares two projections and thirty-five queries against them; both tables and their indexes are created on first use. Without the exporter, events still reach whatever data exporter you have configured — they simply do not land anywhere a dashboard can query.
Note the split of responsibilities, because it explains why both exist:
- Redis holds what is happening now — bans, the allowlist, counters, live incidents and the state a team put on them, tuning candidates, an open learning window. Small, hot, read on the request path or a page refresh.
- Postgres holds what happened — every event, retained and queryable. Large, cold, never on the request path.
Neither substitutes for the other. Learning mode does not read the analytics tables, so it works on an install that has never configured an exporter; the console does not read the shared state, so it keeps working when redis is down.
A reference deployment
                    ┌─────────────┐
   admin UI ───────►│   leader    │──────► postgres  (analytics: events, dashboards)
                    └──────┬──────┘
                           │ state sync
              ┌────────────┼────────────┐
              ▼            ▼            ▼
          ┌───────┐    ┌───────┐    ┌───────┐
 traffic ►│worker │    │worker │    │worker │
          └───┬───┘    └───┬───┘    └───┬───┘
              └────────────┼────────────┘
                           ▼
                         redis      (shared state: bans, incidents, counters, tuning, learning)
The leader reads the admin API. The workers serve traffic and record what they see. The redis is what makes the second visible to the first.
Degrading
Every one of these dependencies fails open on the request path — a redis outage never denies a request, and never lets one through that a local rule would have stopped:
| Failure | Effect |
|---|---|
| Redis unreachable | Bans and allowlist entries already loaded keep applying; new ones do not propagate. The incident console falls back to the node it is served by, and the tuning page to that node's own buffer, and both say so |
| Postgres unreachable | Dashboards stop updating. Detection is unaffected |
| Both | The WAF, bots, reputation and the fabric's local decisions all keep working |
That is the intended shape: the parts that decide about a request are local and synchronous, and the parts that need infrastructure are the ones that let you understand the decisions afterwards.