Events and incidents
One shape for everything
Every decision the fabric takes emits a CloudApimSecurityEvent, in an ECS-shaped envelope:
{
  "@type": "CloudApimSecurityEvent",
  "event":  { "kind": "alert", "category": "threat", "action": "ban",
              "outcome": "blocked", "severity": 4, "module": "cloud-apim.security-suite" },
  "source": { "ip": "203.0.113.7", "apikey": "k1", "user": null },
  "threat": { "score": 95, "tags": ["feed:firehol-l1", "waf:blocked"], "signals": [] },
  "otoroshi": { "route_id": "route_...", "route_name": "public-api", "node": "otoroshi-a1b2" },
  "incident": { "id": "…", "count": 412 },
  "message": "score 95 reached tier 90 (ban)"
}
One parser, one set of dashboards, whichever detector fired. The extension's older per-module events
(CloudApimWafTrailEvent, CloudApimWafReputationEvent) are still emitted alongside it, so nothing
downstream breaks — this one is additive.
| Field | Use |
|---|---|
event.outcome | blocked when actually enforced, observed in dry run |
event.severity | 1–4, derived from the score |
threat.tags | What to group on — the feed, the rule family, the source |
incident.count | How many events this caller has produced in the window |
Incidents
An attack produces thousands of matches and one incident. Alerting on incidents pages someone once instead of nine thousand times.
Events from one identity within a window (30 minutes by default) collapse into a single Incident
carrying the first and last sighting, the count, how many of those were actually enforced, the
highest score seen, the routes touched, and the union of the categories, tags and actions involved.
A caller returning after the window opens a new one.
Threat Protection → Bans & incidents is where you work them; GET /_incidents returns
the same thing.
The timeline
Counters answer how much. The timeline answers what, which is the question actually in front of you: the last twenty events verbatim, each with its category, the action taken, whether that action was enforced or only recorded, and the route it happened on.
Twenty is deliberate. This is a triage view, not a forensic record — the full stream is in the analytics tables, and an incident that needs more than twenty lines is one you open a dashboard for.
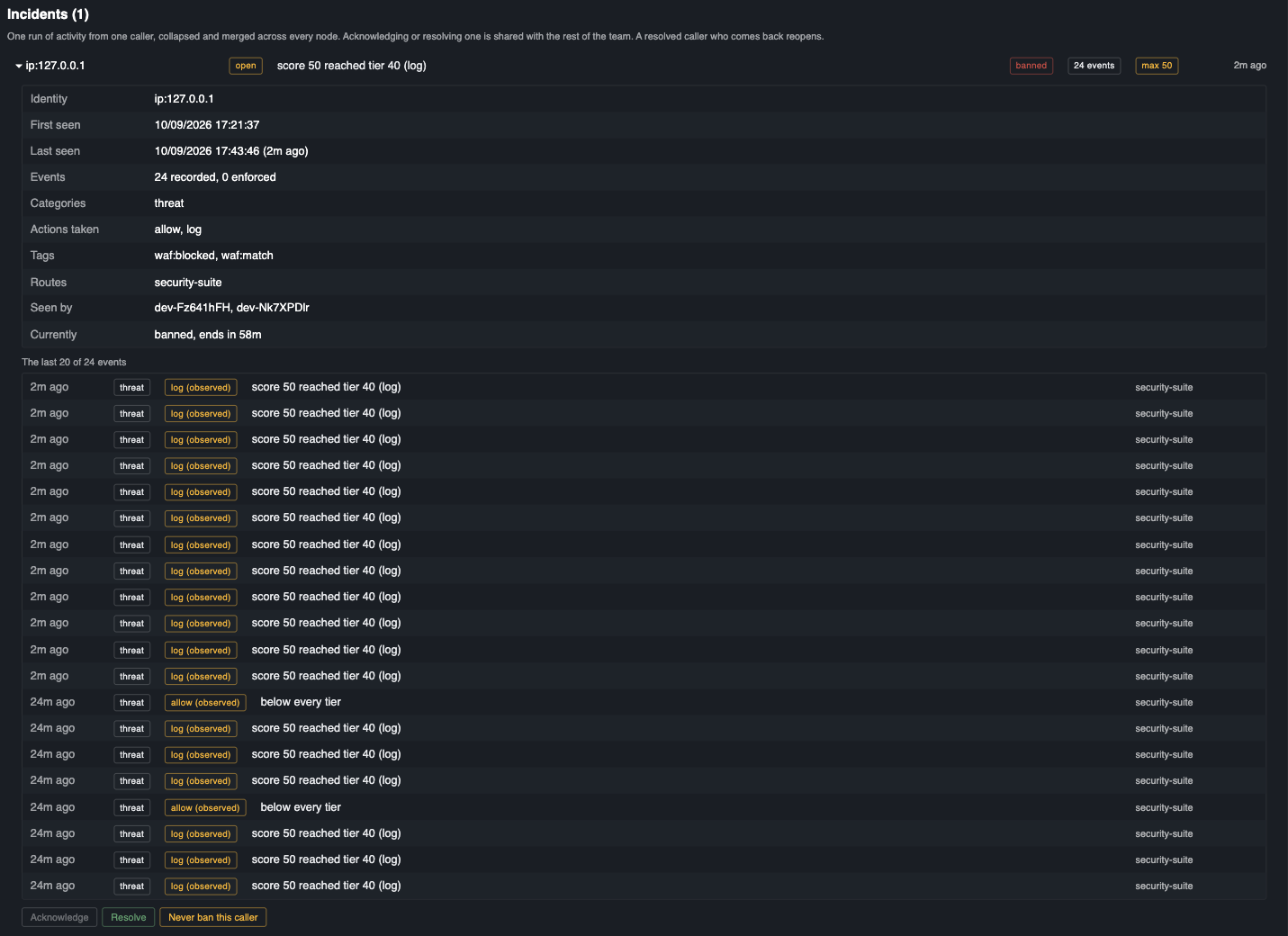
24 recorded, 0 enforced is the dry-run rollout in one line: the fabric decided twenty-four times
and stopped nothing. Seen by names every node that published this caller, and the two timestamps
in the timeline are two separate runs merged into one ordering. Currently: banned saves
cross-referencing the list above.
State, so a team can work them
An incident carries a state — open, acknowledged or resolved — with who set it, when, and an optional note. It is shared across the cluster, so acknowledging one on the leader stops a colleague from picking it up ten seconds later.
Two details that matter more than they look:
A resolved caller who comes back reads reopened, not resolved. Quietly leaving them off the
list is how an attacker gets a second run at you. It does not read open either, because "we have
already looked at this once" is worth keeping.
Acknowledging is not undone by more of the same. You acknowledged it because it is ongoing; reopening on every event would be noise.
The state is keyed by identity rather than by incident id, because the id is minted by whichever node saw the caller first — two nodes watching the same attacker mint two. Acknowledging one and not the other would be worse than having no state at all.
One caller, however many nodes
Correlation is node-local and in memory: it is fed from the request path and has to cost nothing. That makes it exactly the wrong thing to read a console from — on a leader/worker cluster the workers serve the traffic and the leader serves the admin API.
So each node publishes a bounded snapshot of its correlator to the shared state on the same timer that refreshes the bans, under a field only it writes, and the console merges every field. Counts add up, extremes take the extreme, sets union, and the timelines interleave — which is the only place the order of events across the cluster can be seen at all. The detail panel names the nodes that saw the caller, because "one caller, three nodes" is a different problem from "one caller, one node".
A node that dies stops publishing but leaves its field behind, so a field older than five minutes is ignored rather than shown as current.
Without a security.redis-uri on a leader/worker cluster, the console shows only what the node
serving it happened to see. See what a complete deployment needs.
Suggested alerting
| Goal | Filter |
|---|---|
| Something is being enforced | event.outcome: blocked, grouped by source.ip |
| Dry run is ready to be armed | event.outcome: observed with event.action in deny/ban |
| A sustained attack | incident.count over a threshold |
| A detector has gone noisy | group by threat.tags and compare against the previous week |