Security console
Everything the suite decides is emitted as an event. This is the half that reads them back.
Threat Studio puts all of this behind one view organised by workspace, with the analytics scoped to the routes each workspace governs. This page stays the reference for what the backoffice itself offers, and for the queries — which both consoles share.
The way in is Threat Protection → Overview, the first entry in the menu. It explains how the pieces fit together and reads the live state of the install — routes protected, what is held right now, tuning candidates waiting, whether the shared state actually spans the cluster — and leads with the one thing worth doing next. It is a starting point rather than a second copy of the menu.
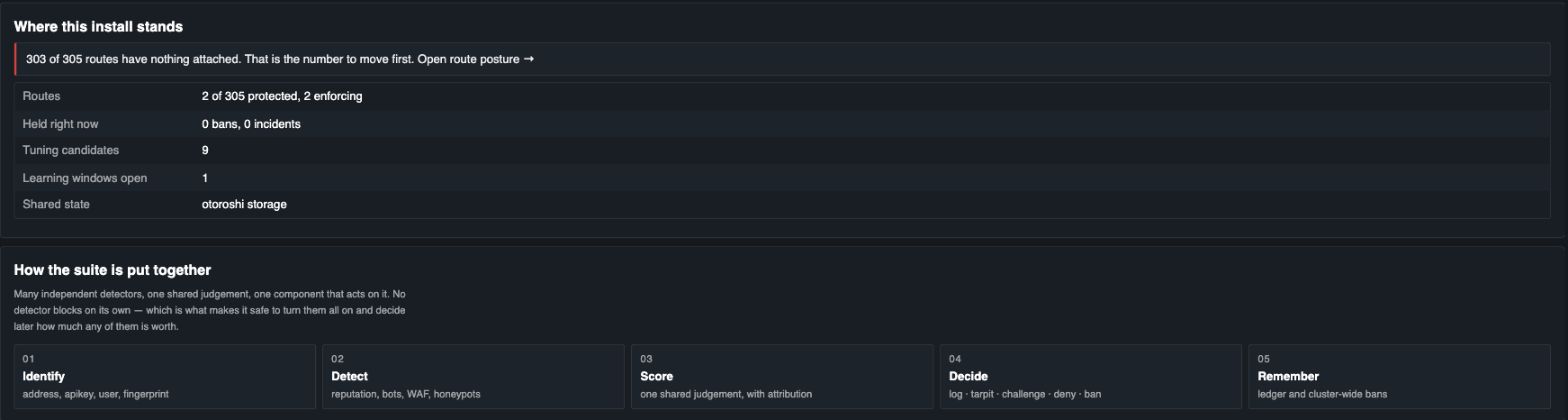
The line at the top is chosen from the numbers under it, ordered by what blocks what: a route with nothing attached beats a tuning backlog, and a shared state that is not shared beats both — because it makes every other number on the page unreliable.
The surfaces underneath it have very different requirements:
| Needs | Answers | |
|---|---|---|
| Route posture | nothing | Which routes are protected, in which mode — now |
| Bans & incidents | nothing | Who is being stopped right now, on what evidence, and what to do about them |
| WAF tuning | nothing | Which rules are firing on legitimate traffic, and what to do about it |
| WAF learning mode | nothing | Whether this configuration can be armed yet, and what it would cost |
| Dashboards and queries | the user-analytics exporter (postgres) | What happened, over time |
Three of those pages need nothing to work, but need the shared state to see the whole cluster — see what a complete deployment needs. Route posture is the exception: it reads live routing state, which every node already has.
Route posture
Threat Protection → Route posture.
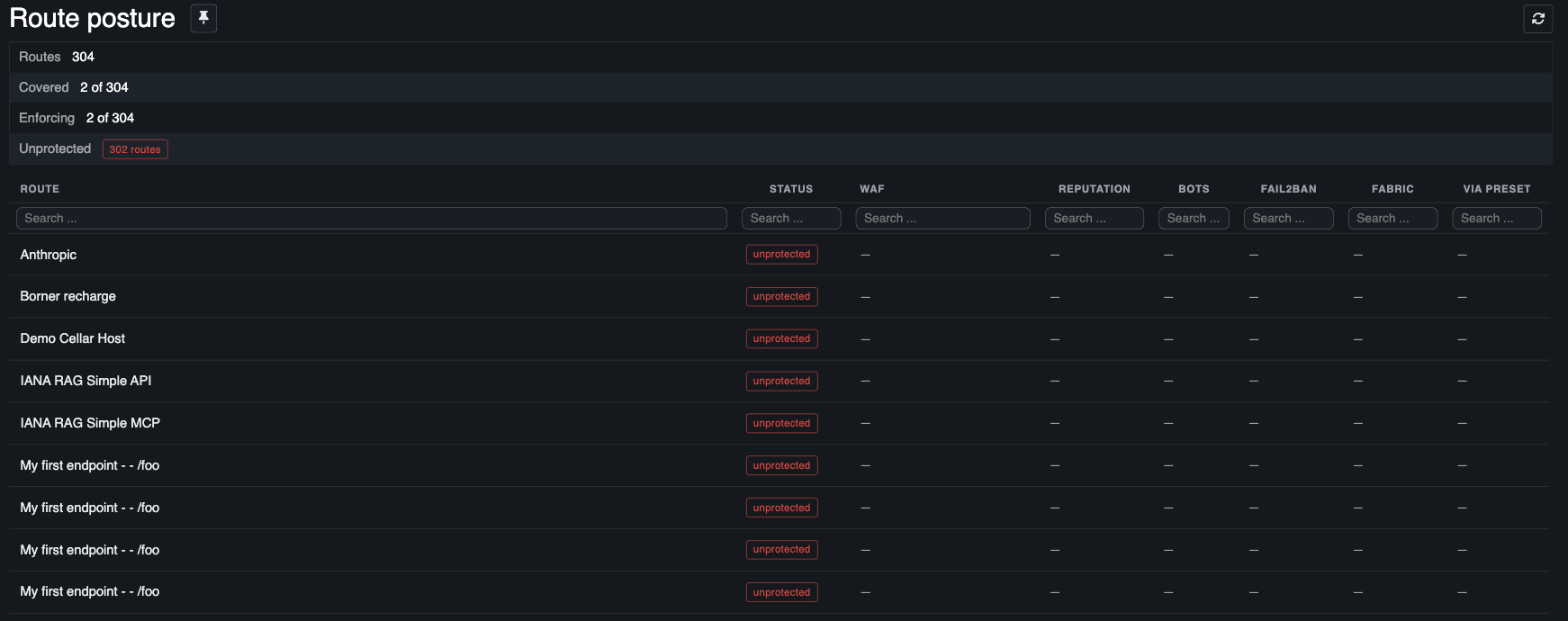
The summary is the point of the page. "Covered" and "Enforcing" are counted separately because a route with the whole suite attached in dry run stops nothing.
It walks every route in the router and reports what is actually attached to it:
| Route | Status | WAF | Reputation | Bots | Fail2ban | Fabric |
|---|---|---|---|---|---|---|
| public-api | enforcing | crs · block | block | on | armed | armed |
| partner-api | observing | crs · monitor | monitor | on | dry run | dry run |
| docs | observing | crs · monitor | — | on | — | dry run |
| legacy-soap | unprotected | — | — | — | — | — |
It is the same sortable, searchable table as every other list in the backoffice, and the default
order puts the gaps first — unprotected sorts before observing before enforcing. A summary
strip above it leads with the count, because nobody goes looking for a route they forgot to
protect.
Two distinctions it is careful about:
- Covered is not enforcing. A route can have the whole suite attached and stop nothing — a WAF in monitoring mode behind a threat policy in dry run. Both are counted separately, because "protected" that means "configured" is how a rollout stalls for six months without anyone noticing.
- A preset counts as what it expands to. The preset is one plugin slot that becomes five at request time; the page reads its flags rather than running the expansion, so it reports coverage with no request in flight. A section left off is not claimed.
It reads live state and touches no analytics at all — it works before a single event has been emitted.
Bans & incidents
Threat Protection → Bans & incidents. The console during an incident, rather than the report afterwards.
Three registers, in the order an incident gets worked:
| Active bans | What the fabric is holding right now — who, why, on what evidence, until when |
| Incidents | What it is still watching, merged across every node, with a state a team can move |
| Allowlist | What it has been told to leave alone |
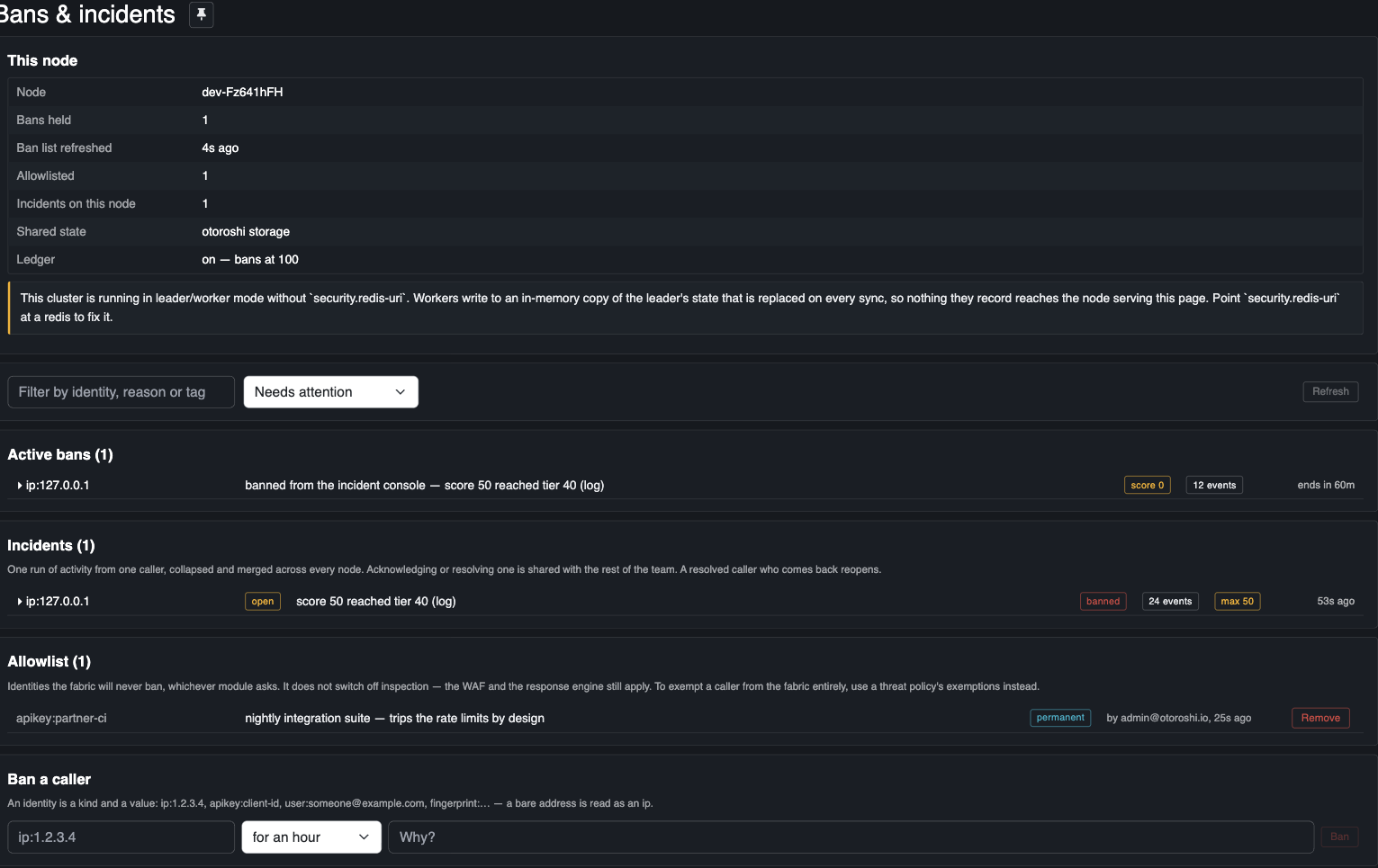
Three registers on one page, and the node's own state above them. The badge on a ban counts the events behind it; the one on an incident says whether the caller is currently held.
Every row opens for its evidence, and every action is one click from that evidence rather than from a separate form: extend a ban, lift it, acknowledge or resolve an incident, ban a caller for an hour, or put them on the allowlist for good.
It reads the shared state and no analytics at all, so it works before an exporter exists — and it
says which shared state it is reading, because on a leader/worker cluster without a
security.redis-uri an empty list means "this node saw nothing", not "nothing happened".
The detail is in bans and the allowlist and events and incidents.
Dashboards and queries
Otoroshi stores analytics events in PostgreSQL, through a data exporter you configure (Data exporters → user analytics). Without one, the events are still emitted and still reach any exporter you have wired — but there is nothing to query, and the dashboards will be empty.
A dashboard, ready on first boot
The suite seeds a Threat protection dashboard the first time it runs against a configured exporter. It is an ordinary user dashboard: rearrange it, delete widgets, or delete the whole thing. It is only recreated if its marker is gone, so your edits survive a restart.
The top row answers is anything happening, and is any of it real; the bottom row is the tuning backlog.
The queries
All of them appear in the widget wizard, compose into your own dashboards, and can be alerted on.
| Query | Shape | What it answers |
|---|---|---|
cloudapim_security_events_total | metric | How many decisions the fabric took |
cloudapim_security_enforced_total | metric | How many of them actually stopped something |
cloudapim_security_events_over_time | area | Attack volume |
cloudapim_security_enforced_over_time | area | Enforcement volume |
cloudapim_security_by_outcome | donut | Blocked versus observed — the dry-run ratio |
cloudapim_security_by_category | donut | Which detector decided |
cloudapim_security_by_action | pie | Distribution across log, challenge, throttle, tarpit, deny, ban and mask |
cloudapim_security_top_sources | bar | The addresses decided against most |
cloudapim_security_top_tags | bar | Which signal is actually catching things |
cloudapim_security_top_routes | bar | Where decisions are being taken |
cloudapim_waf_top_rules | bar | Top triggered SecLang rules |
cloudapim_waf_would_have_blocked | area | Requests a monitoring WAF reached a deny on |
Eighteen more were added for Threat Studio and are listed there: enforcement over time, score distribution, an hour-by-weekday heatmap, sources by spread and by score, per-signal enforcement share, per-route enforcement, incidents, api keys and users, the WAF rules behind the blocks, body-limit pressure, decisions by node, and two log queries returning the events themselves.
Every query takes a route_ids parameter. The shared filters carry a single route_id, which
cannot express "these twelve routes"; passing a list narrows any of these queries to a set, and an
empty list means the whole fleet.
The last two of the table above are the tuning pair: top rules tells you what to look at, would have blocked tells you what arming will cost. Once you know which rule to look at, the tuning assistant is where you act on it — it works from its own in-memory sample of recent matches, so it needs none of this.
cloudapim_security_top_tags is the one to reach for when someone asks whether a feed is worth
keeping — it ranks by tag, so reputation:firehol1, asn:hosting, bot:seo and waf:match are
all directly comparable.
The filters work like everywhere else
Period, route, api, apikey, group and tenant apply to these queries exactly as they do to gateway traffic, because the tables declare the same column contract Otoroshi's own analytics use.
Where the rows live
Two tables, alongside Otoroshi's own:
| Table | Written by | Holds |
|---|---|---|
<table>_cloudapim_security | every fabric decision | category, action, outcome, score, tags, enforced, incident |
<table>_cloudapim_waf | the WAF | rule ids, blocking mode, whether it reached a deny, truncation |
Both honour the exporter's retention_days.
enforced is denormalised on purpose: it is the only question a dry-run rollout asks, and a
dashboard should not have to reach into the raw JSON to get it. The full event is kept in raw, so
any row can be drilled into — including its signals, which is what answers why.