Built-in dashboards
The extension plugs straight into Otoroshi's user dashboards. Turn on user analytics once, and your AI gateway comes with a full console: what it costs, who spends it, how fast and how reliably models answer, what your traffic emits, and what your agents call through MCP — no Kibana, no Grafana, no pipeline to maintain.
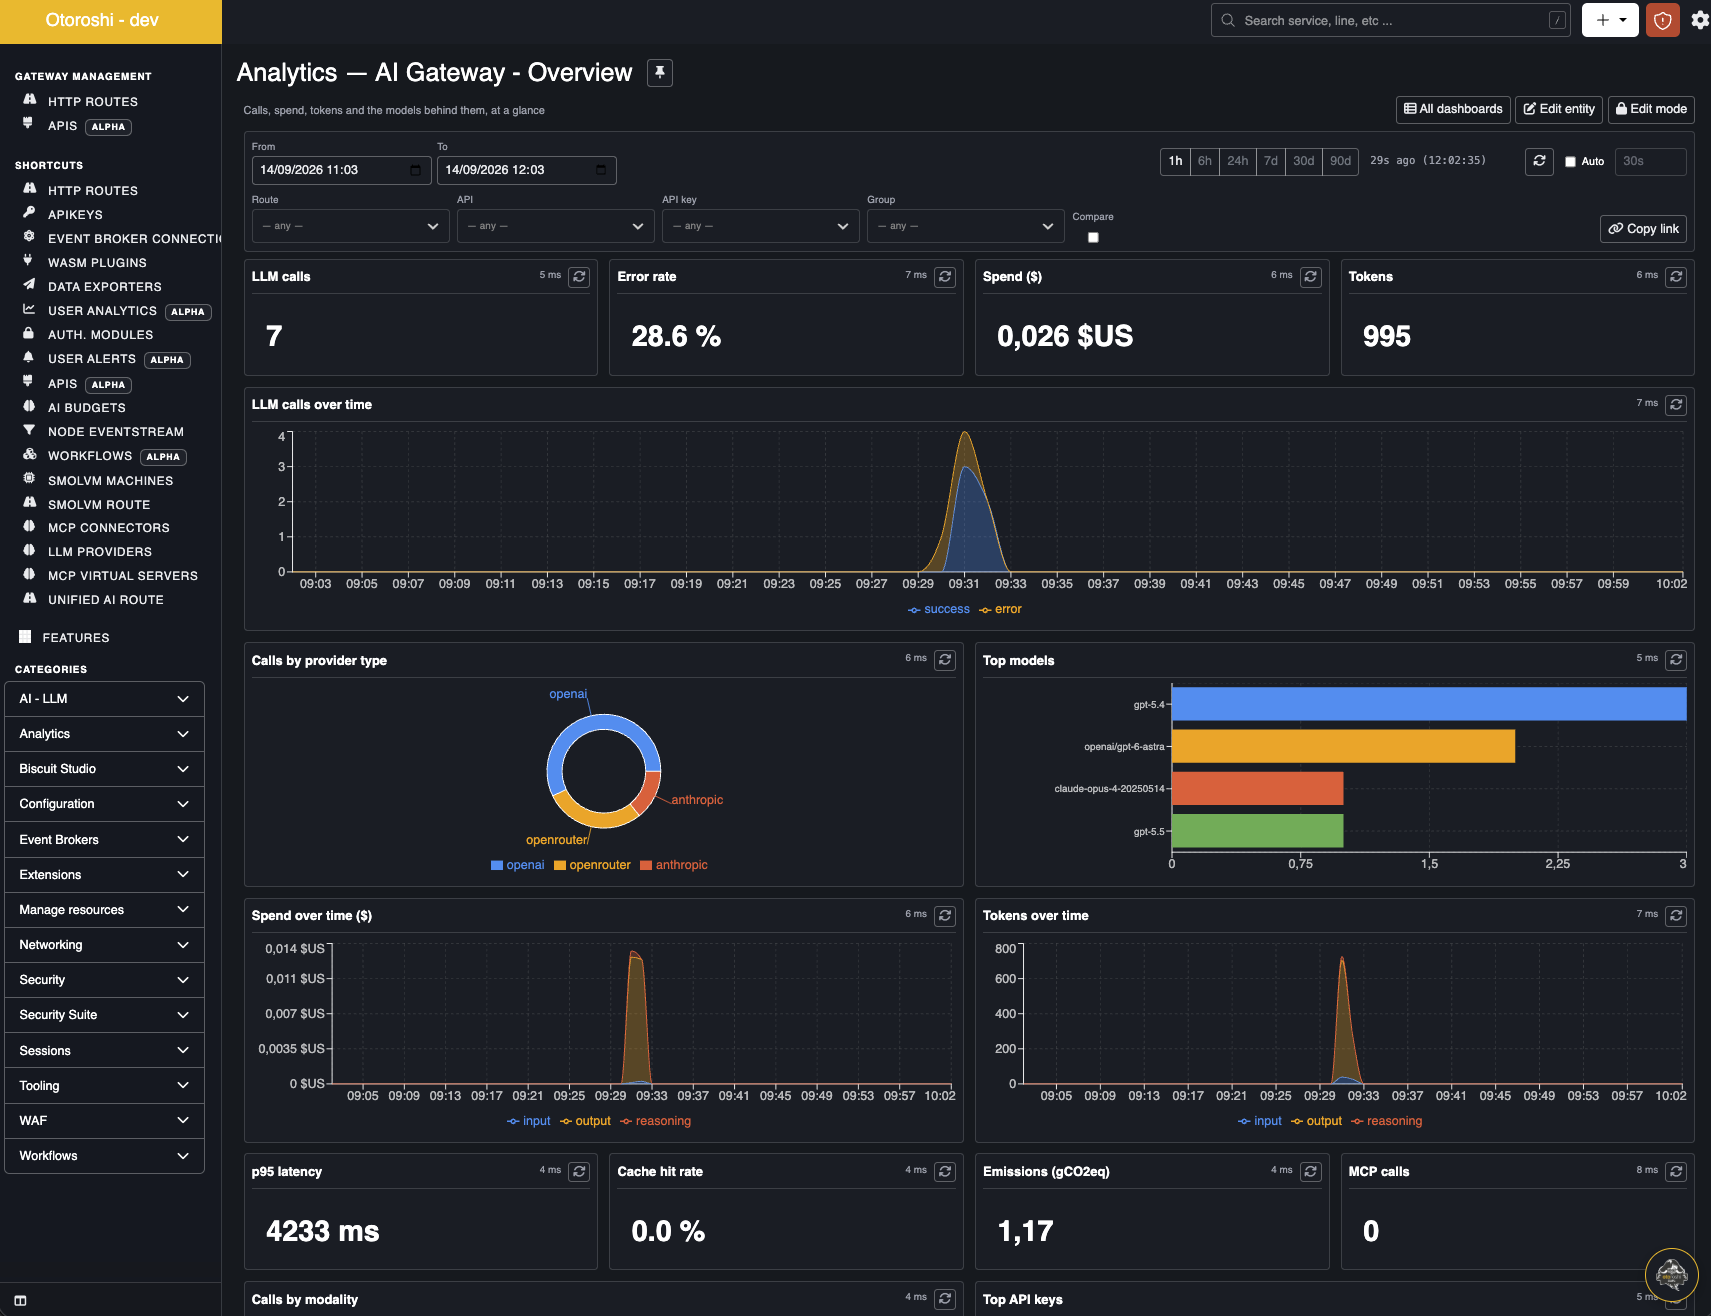
The overview answers the first questions in one screen: how much traffic, how much of it fails, what it costs, and which vendors and models carry it.
Every number is also a query you can drop into your own dashboards, filter by route, API, API key, group or tenant, and alert on: a daily spend threshold, an error rate on a provider, a tool that starts failing.
Getting started
Dashboards read from Otoroshi's user-analytics database (PostgreSQL). If you have not set it up yet:
- Go to Data exporters and create a User Analytics (PostgreSQL) exporter.
- Mark it as the active user-analytics exporter.
That's it. On the next sync the extension installs its dashboards next to Otoroshi's own, and every LLM call, MCP request and AI alert starts landing in its own tables.
MCP servers exposed by Otoroshi report their traffic when emit_audit_events is enabled on the
MCP plugin or virtual server; MCP connectors report theirs when audit_events is enabled on the
connector. Turn them on for the servers you want to see in the MCP dashboards.
The installed dashboards are ordinary user dashboards: rearrange them, change a widget, add your own queries, rename or delete them. A dashboard you have not touched stays up to date as the extension improves it; one you have customised is yours and is never overwritten. Delete it to get the latest version back on the next restart.
The dashboards
| Dashboard | What it answers |
|---|---|
| AI Gateway - Overview | Calls, error rate, spend, tokens, vendors and models at a glance; usage by modality, weekly activity pattern, latest calls |
| AI Gateway - Costs | Spend over time and by model, provider, API key, user and route; projected monthly spend; the effective price per million tokens; a per-model summary table |
| AI Gateway - Tokens & cache | Input, output and reasoning tokens; who consumes them; prompt weight and output ratio per model; cache hit rate |
| AI Gateway - Budgets | Where every budget stands in its current cycle, spend and tokens per budget, budget warnings and overruns |
| AI Gateway - Ecological impact | Energy, CO2eq emissions (usage and embodied), water, primary energy and mineral depletion — and the carbon efficiency of each model |
| AI Gateway - Performance | Latency percentiles and heatmap, slowest models and providers, generation speed in tokens per second |
| AI Gateway - Reliability | Error rate, error kinds and messages, failing providers and models, guardrail denials, provider quota incidents, rate-limit headroom |
| AI Gateway - Consumers | The chargeback view: calls, tokens, spend, errors and emissions per API key, user and route |
| MCP - Overview | MCP traffic served and consumed, methods, transports, protocol versions, top and failing tools, servers and connectors |
| MCP - Tools & security | A per-tool table, tool latency, failing connectors and resource fetches, and every zero-trust event (rug-pulls, guardrails, redactions) |
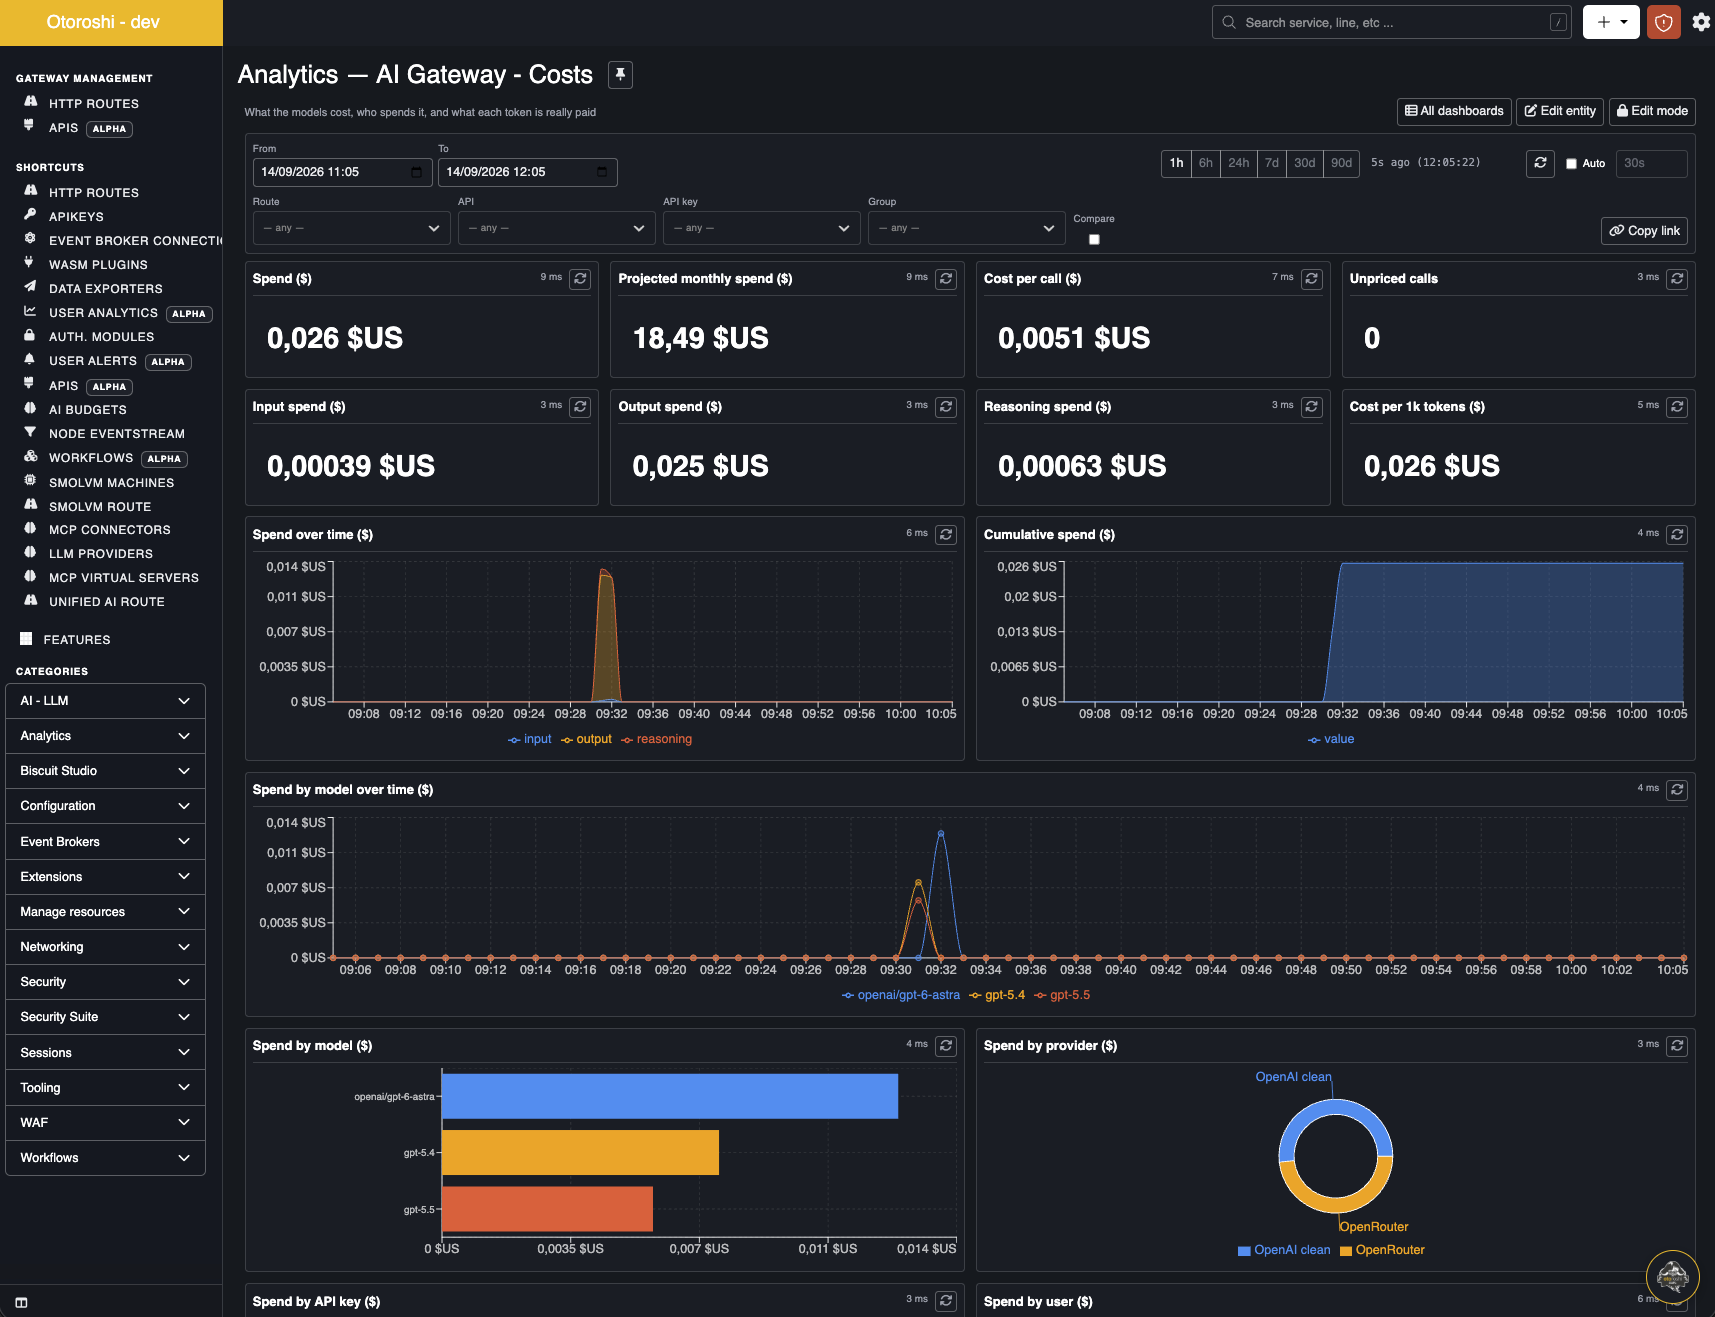
The costs dashboard: what was spent, what the month will cost at this pace, how the bill splits between input, output and reasoning tokens, and which models drive it.
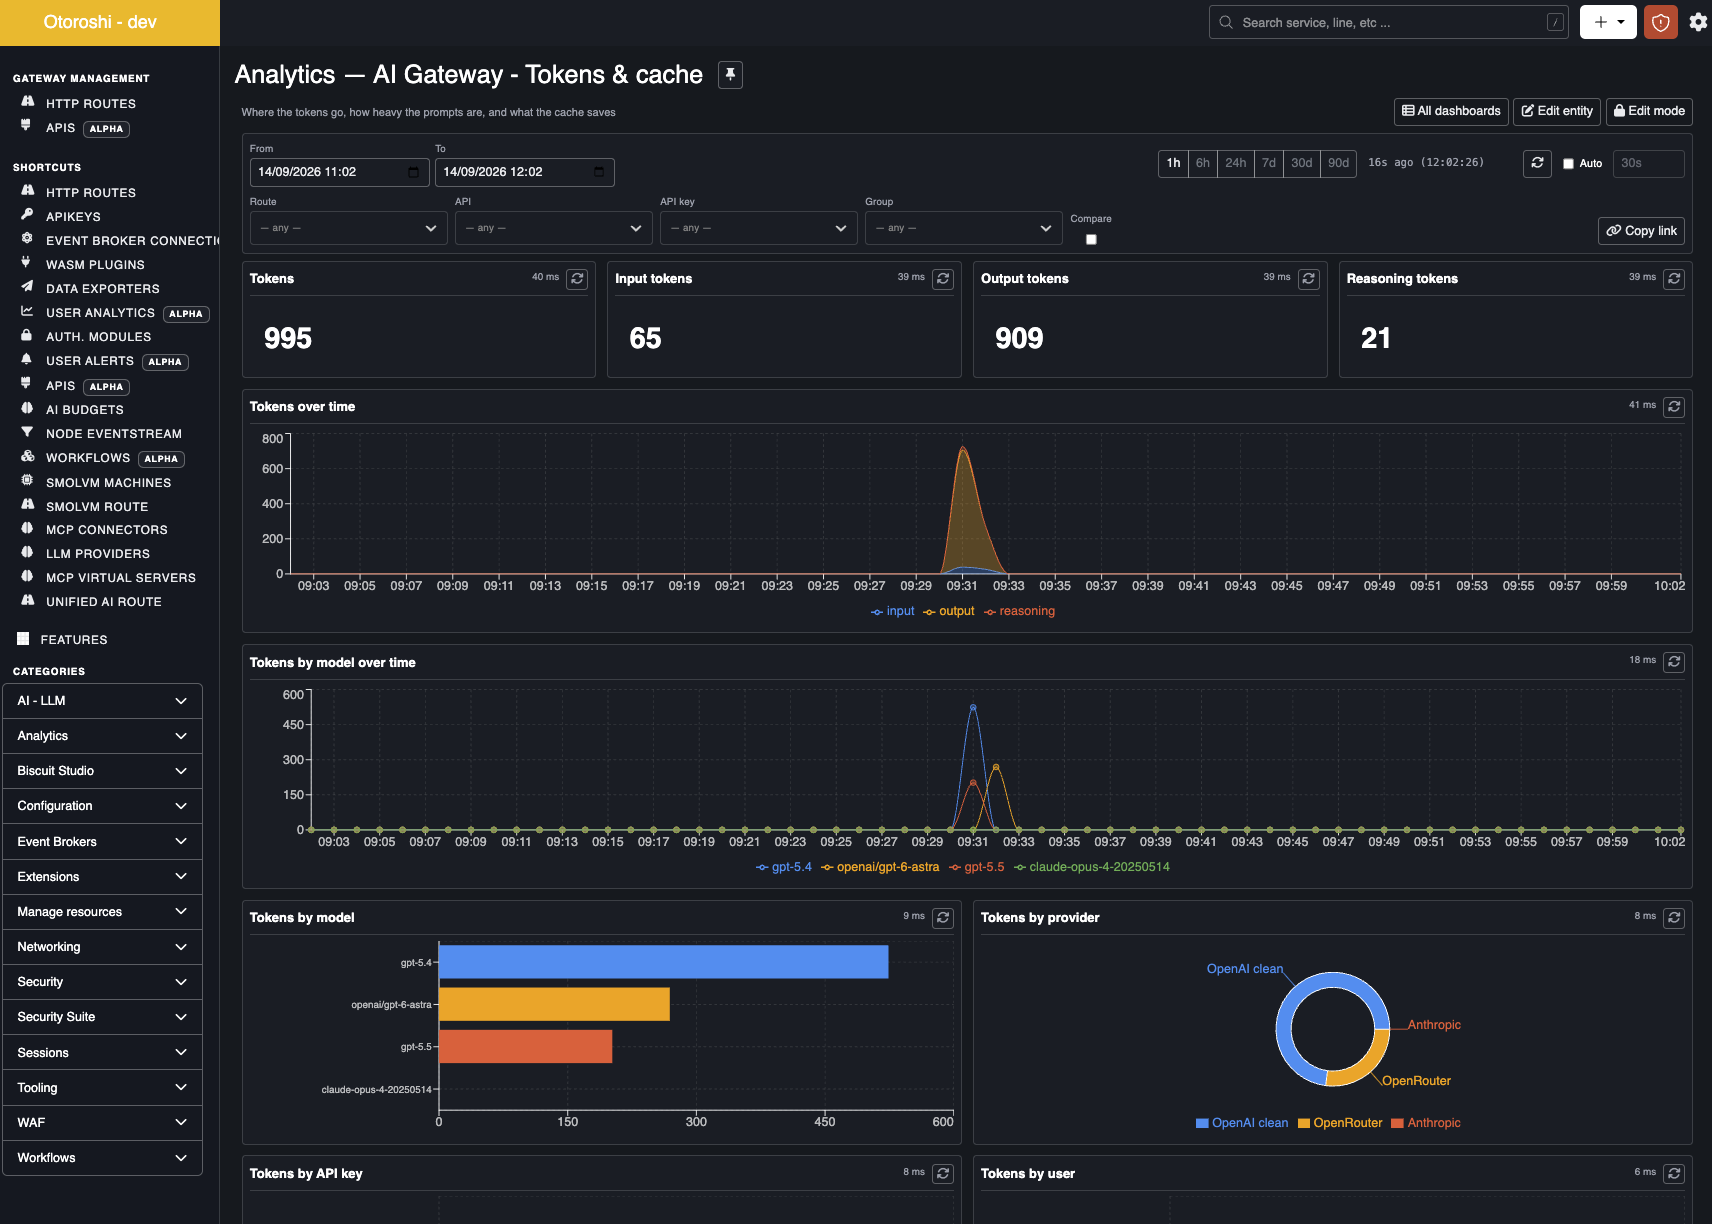
Tokens & cache: where the tokens go — input versus output versus reasoning, model by model, provider by provider.
Numbers you can trust
- Every call is counted once. Behind a load balancer, a router or a fallback, the call is attributed to the provider that actually served it — spend and tokens are never doubled.
- Every modality is covered. Chat, responses, embeddings, images, audio, video, moderation and OCR share the same columns, so one widget compares them all.
- Cache hits are visible. They count as calls, with no tokens and no cost, and feed the cache hit rate.
- Units read without a calculator. Dollars, watt-hours, grams of CO2eq, litres of water, milligrams of antimony-equivalent.
- Content stays out. Prompts, completions, embeddings, images, transcripts, tool arguments and tool results are never written to the analytics database, and neither are API key secrets or user sessions. What is stored is what the dashboards read: who, which model, how much, how long, and whether it worked.
Queries
All queries appear in the widget wizard under their name. Scalar queries support the compare with previous period option.
Every LLM query also takes a modality parameter — chat, responses, completion,
embedding, image, audio, video, moderation or ocr — to build the same view for one kind of
usage: image generation spend, embedding latency, audio tokens by API key.
LLM usage
| Query | Widget | |
|---|---|---|
cloudapim_llm_requests_total | metric | LLM calls |
cloudapim_llm_errors_total / cloudapim_llm_error_rate | metric | Failed calls, and their share |
cloudapim_llm_requests_over_time | area | Successful and failed calls |
cloudapim_llm_requests_per_second | line | Call rate |
cloudapim_llm_by_provider_kind / cloudapim_llm_by_provider | donut | Calls per vendor, per provider |
cloudapim_llm_by_modality / cloudapim_llm_by_operation | donut / pie | Calls per modality, per endpoint family |
cloudapim_llm_streaming_ratio | donut | Streaming versus blocking |
cloudapim_llm_top_models / _top_providers / _top_apikeys / _top_users / _top_routes | bar | Rankings by calls |
cloudapim_llm_requests_by_model_over_time / _requests_by_modality_over_time | line / area | One series per model, per modality |
cloudapim_llm_activity_heatmap | heatmap | When the gateway is used: calls by weekday and hour |
cloudapim_llm_distinct_users / _distinct_apikeys / _distinct_models / _distinct_providers | metric | How many consumers, models and providers are active |
cloudapim_llm_apikeys_table / _users_table / _routes_table | table | Calls, tokens, spend, errors and emissions per consumer |
cloudapim_llm_recent_calls | table | The latest calls: consumer, model, tokens, cost, duration, status |
Tokens and cache
| Query | Widget | |
|---|---|---|
cloudapim_llm_tokens_total / _input_tokens_total / _output_tokens_total / _reasoning_tokens_total | metric | Tokens consumed |
cloudapim_llm_tokens_per_request | metric | Average tokens per call |
cloudapim_llm_tokens_over_time | area | Input, output and reasoning tokens |
cloudapim_llm_tokens_by_model / _by_provider / _by_modality / _by_apikey / _by_user / _by_route | bar / donut | Who and what consumes tokens |
cloudapim_llm_prompt_completion_ratio | metric | Prompt tokens sent per token generated |
cloudapim_llm_tokens_by_model_over_time | line | One series per model |
cloudapim_llm_tokens_per_request_by_model | bar | Where prompts or answers are heaviest |
cloudapim_llm_output_ratio_by_model | bar | Generated tokens per prompt token |
cloudapim_llm_cache_hit_rate / _cache_hits_total | metric | Cache effectiveness |
cloudapim_llm_cache_over_time / _cache_by_status | area / donut | Hits, misses, refreshes |
Costs
| Query | Widget | |
|---|---|---|
cloudapim_llm_cost_total / _cost_per_request | metric | Spend, and the average call |
cloudapim_llm_input_cost_total / _output_cost_total / _reasoning_cost_total | metric | Spend by token type |
cloudapim_llm_cost_per_1k_tokens | metric | The blended price paid per thousand tokens |
cloudapim_llm_cumulative_cost_over_time | area | The burn curve: running total over the period |
cloudapim_llm_cost_monthly_projection | metric | The selected period extrapolated to 30 days |
cloudapim_llm_cost_over_time | area | Input, output and reasoning cost |
cloudapim_llm_cost_by_model / _by_provider / _by_modality / _by_apikey / _by_user / _by_route | bar / donut | Where the money goes |
cloudapim_llm_cost_by_model_over_time | line | One series per model |
cloudapim_llm_cost_per_million_tokens_by_model | bar | The price actually paid, reasoning included |
cloudapim_llm_cost_by_source | pie | Price table versus provider-reported costs |
cloudapim_llm_unpriced_requests | metric | Calls with no cost attached — a model missing from the price table |
cloudapim_llm_models_table | table | The model leaderboard: calls, tokens, spend, $ per 1k tokens, latency, error rate, gCO2eq per 1k tokens |
Budgets
| Query | Widget | |
|---|---|---|
cloudapim_llm_budgets_consumption | table | Spent and allowed dollars and tokens, per budget, for the current cycle |
cloudapim_llm_budgets_usage | bar | How close each budget is to its limit |
cloudapim_llm_requests_by_budget / _cost_by_budget / _tokens_by_budget | bar | Usage counted against each budget |
cloudapim_llm_cost_by_budget_over_time | line | One series per budget |
cloudapim_llm_budget_exceeded_total / _budget_almost_exceeded_total | metric | Overruns and warnings |
cloudapim_llm_budget_alerts_over_time / _budget_alerts_by_budget | area / bar | Which budgets are under pressure, and when |
The two budget status queries read the budgets' live counters — the ones that enforce the limits — so they are exact for the whole cycle, whatever period the dashboard shows.
Ecological impact
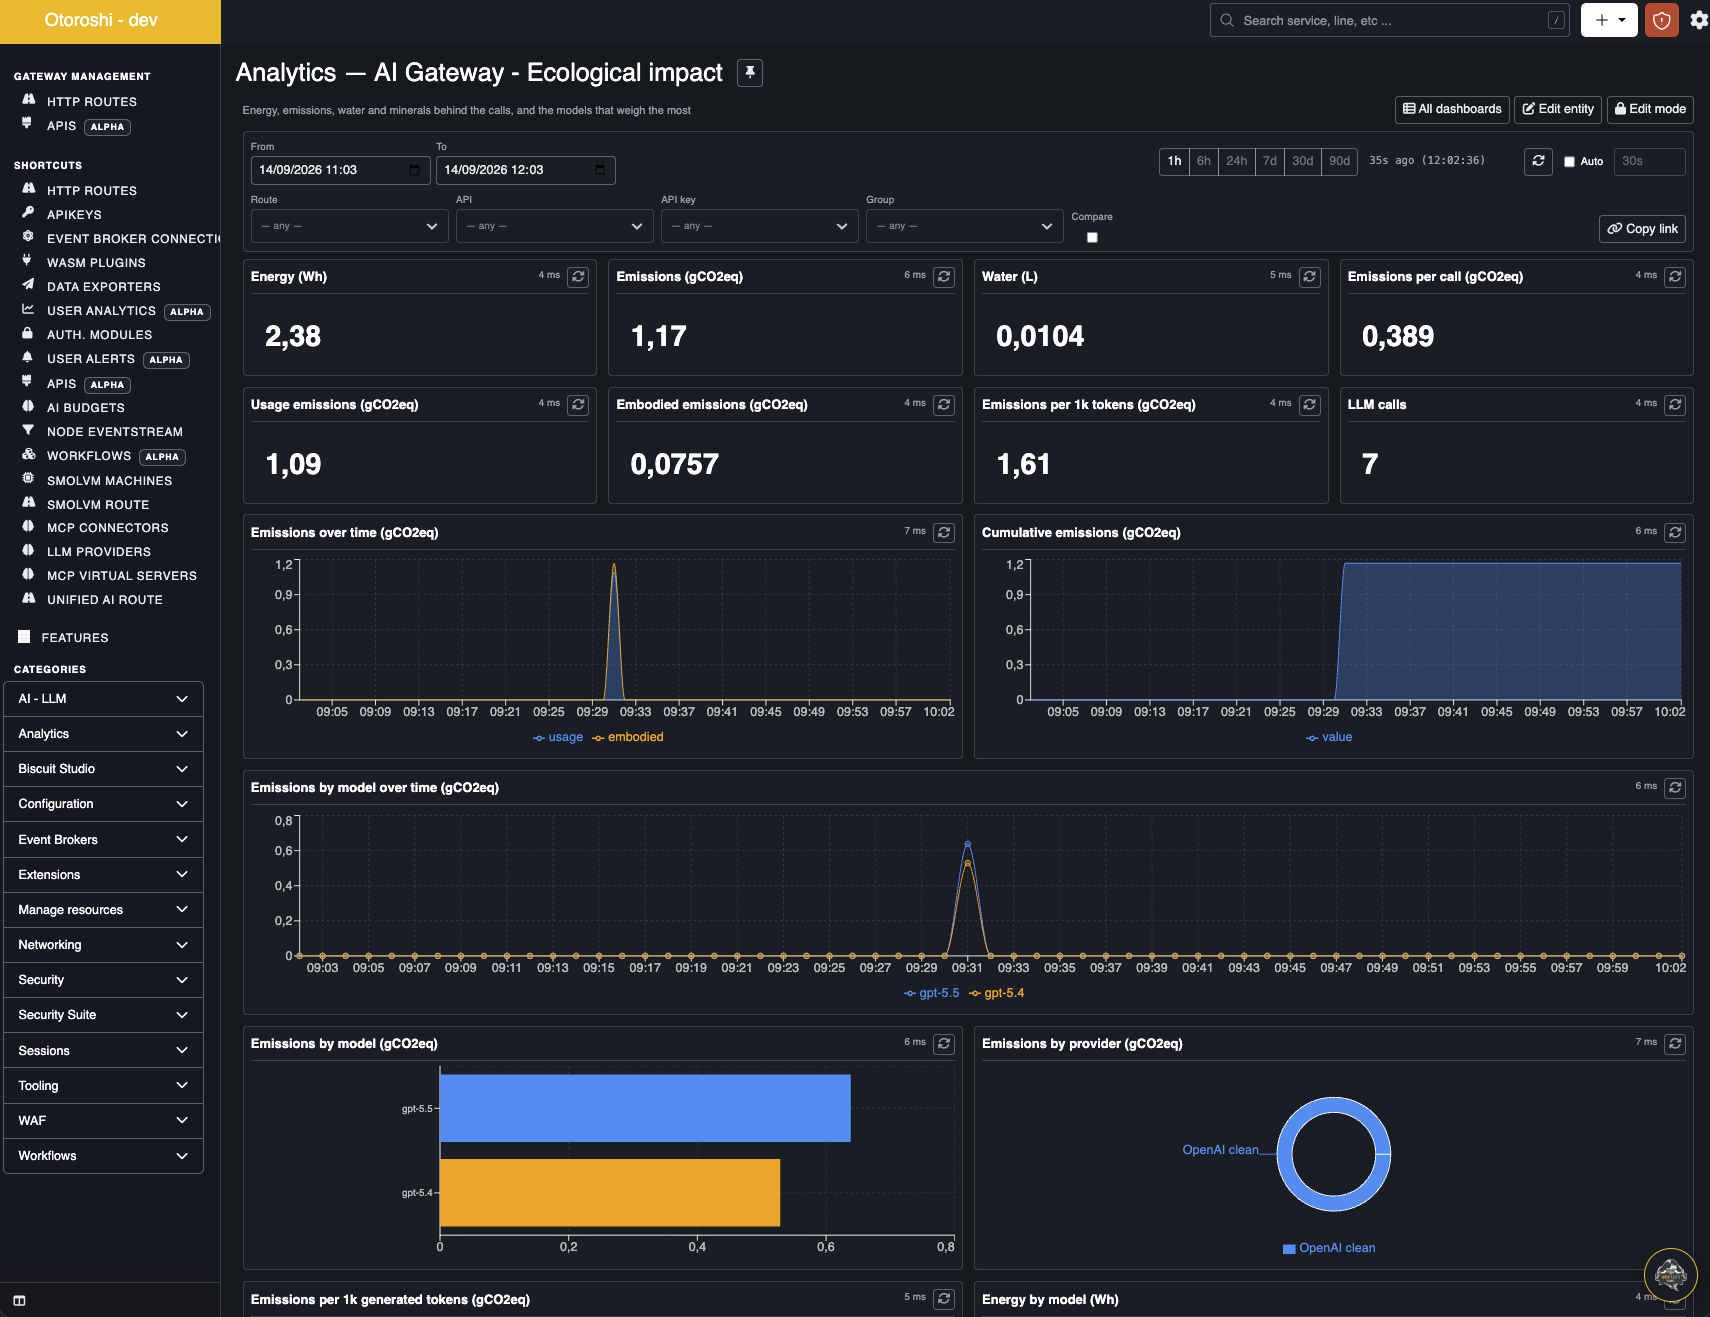
The ecological impact dashboard: energy, emissions and water behind the calls, split between usage and hardware manufacturing, and the models that weigh the most.
| Query | Widget | |
|---|---|---|
cloudapim_llm_energy_total | metric | Energy, Wh |
cloudapim_llm_gwp_total / _gwp_per_request / _gwp_per_1k_tokens | metric | Emissions, gCO2eq |
cloudapim_llm_gwp_usage_total / _gwp_embodied_total | metric | Usage and embodied emissions |
cloudapim_llm_cumulative_gwp_over_time | area | Running total of emissions |
cloudapim_llm_pe_over_time | area | Primary energy |
cloudapim_llm_wcf_total / _pe_total / _adpe_total | metric | Water (L), primary energy (MJ), abiotic depletion (mgSbeq) |
cloudapim_llm_gwp_over_time | area | Usage and embodied emissions |
cloudapim_llm_energy_over_time | area | Energy |
cloudapim_llm_gwp_by_model / _by_provider / _by_apikey / _energy_by_model | bar / donut | Who and what emits |
cloudapim_llm_gwp_by_model_over_time | line | One series per model |
cloudapim_llm_gwp_per_1k_output_tokens_by_model | bar | Carbon efficiency: the same answer, a very different footprint |
See Ecological impact for how impacts are estimated.
Performance and reliability
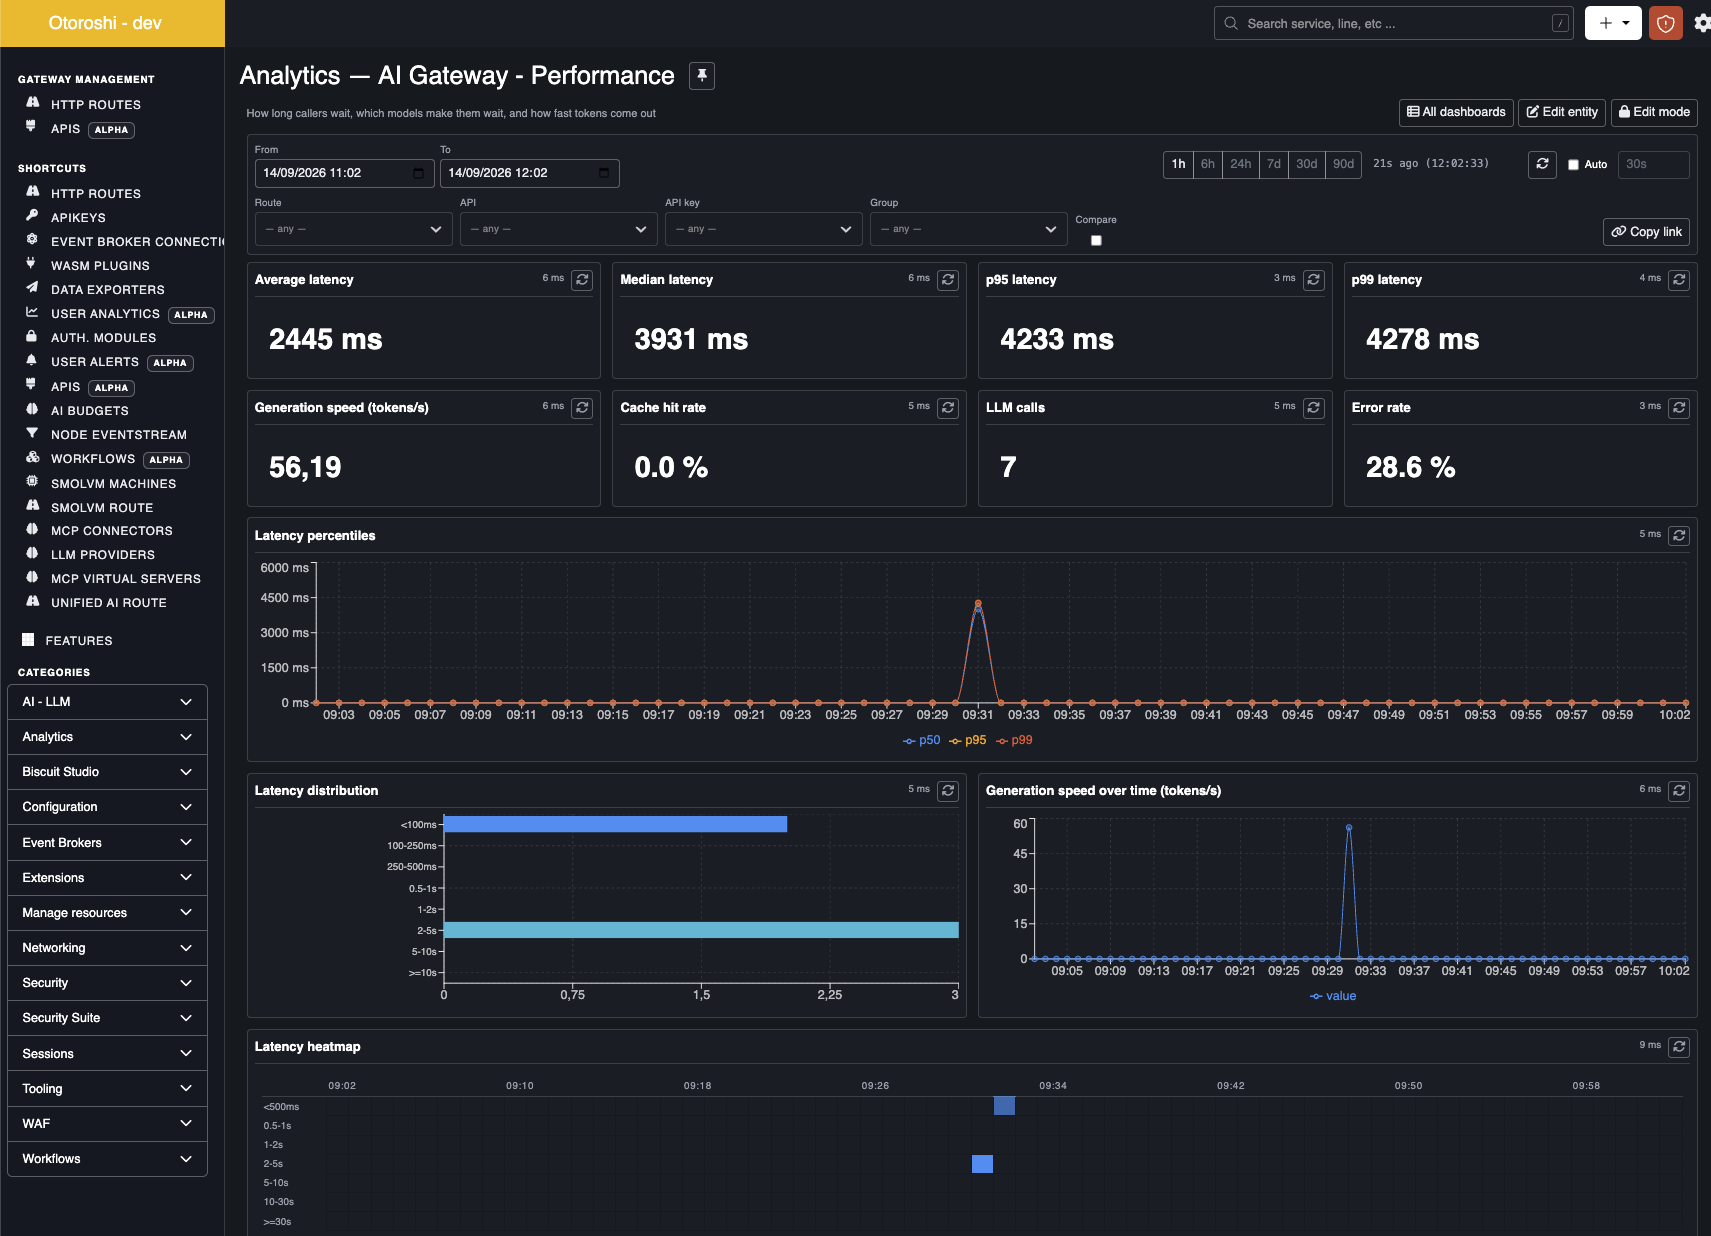
Performance: how long callers wait — median and tail — how fast tokens come out, and when latency spikes.
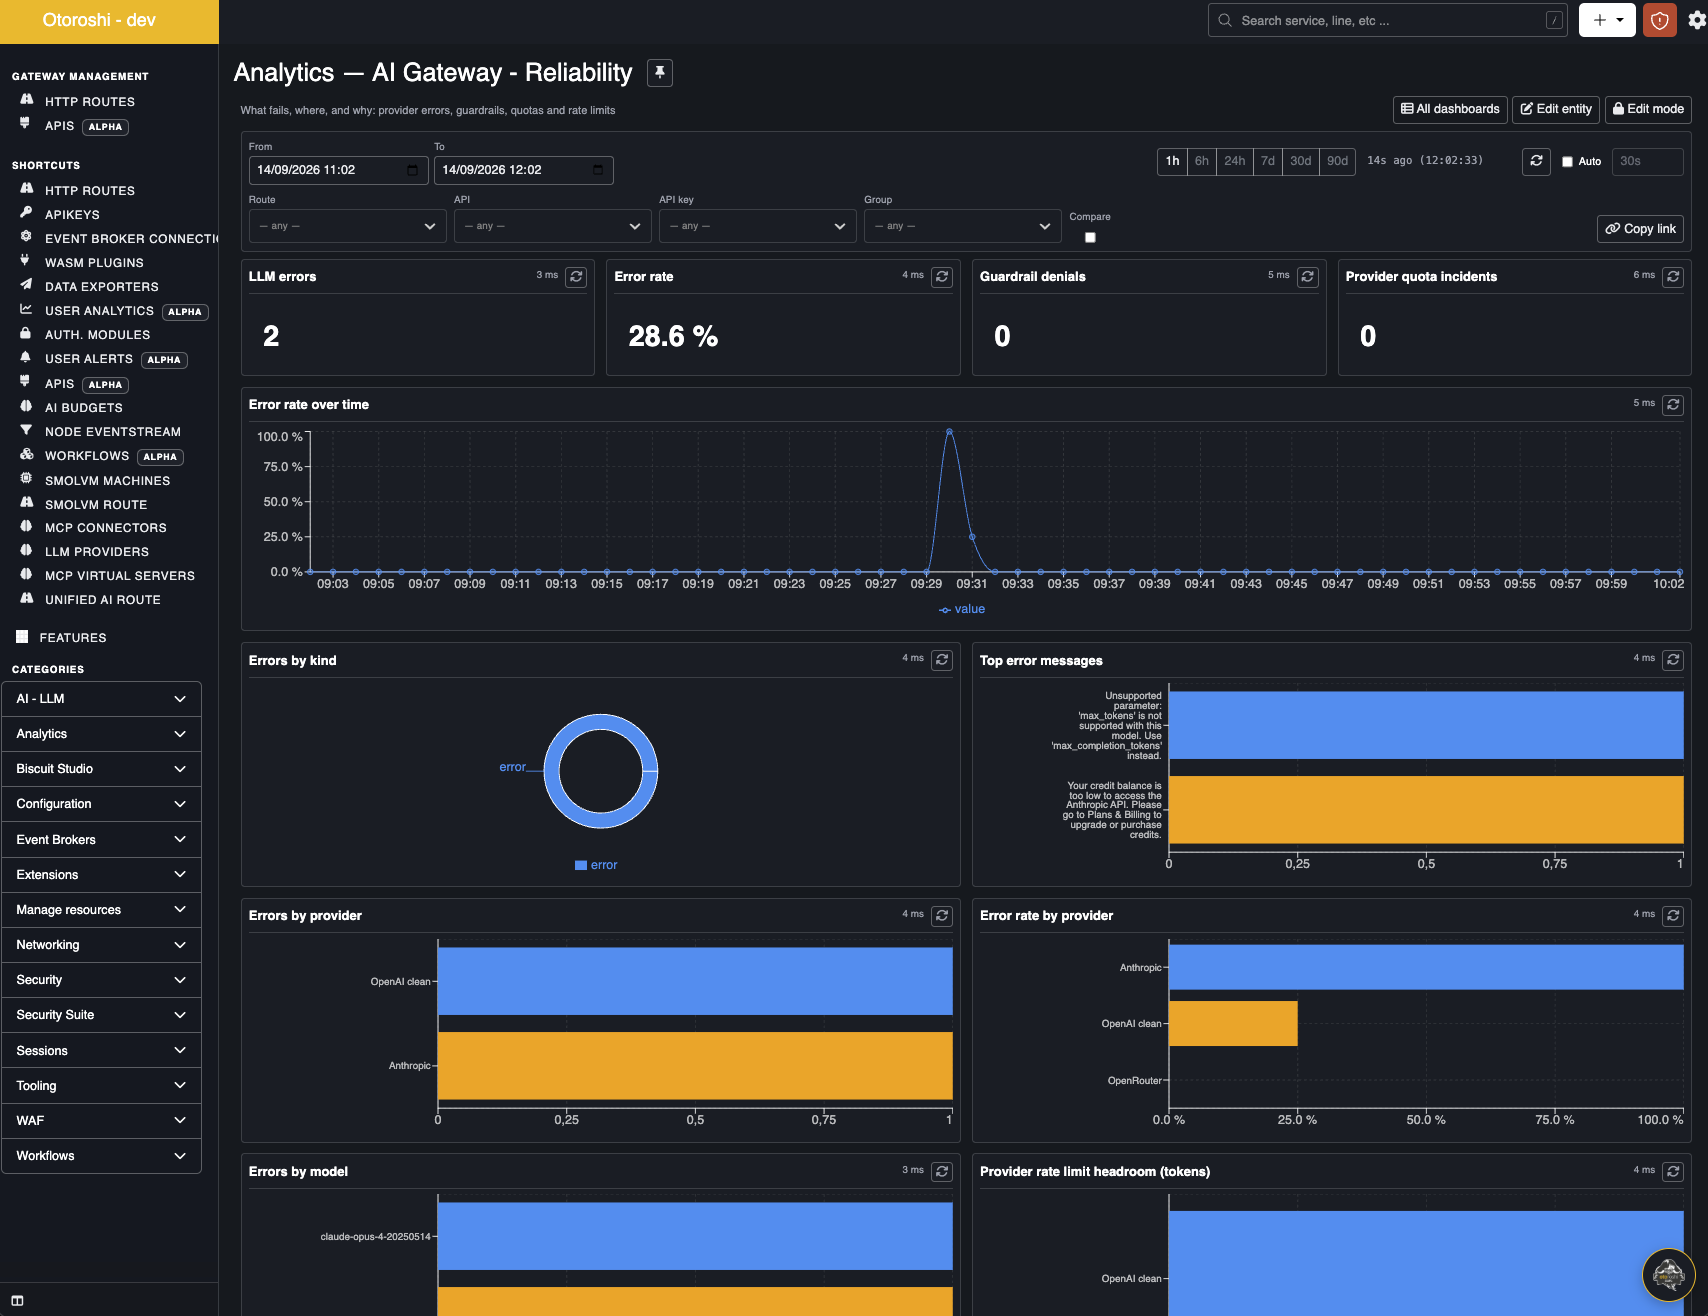
Reliability: the error rate over time, and straight to the cause — the actual provider messages, and the providers and models they come from.
| Query | Widget | |
|---|---|---|
cloudapim_llm_latency_avg / _latency_p50 / _latency_p95 / _latency_p99 | metric | Call duration |
cloudapim_llm_latency_distribution | bar | Calls by duration band |
cloudapim_llm_output_tokens_per_second / _output_tokens_per_second_over_time | metric / line | Generation speed |
cloudapim_llm_latency_avg_over_time / _latency_percentiles_over_time | line | Average, p50, p95, p99 |
cloudapim_llm_latency_heatmap | heatmap | Durations by band over time |
cloudapim_llm_latency_by_model / _latency_p95_by_model / _latency_by_provider | bar | Who makes callers wait |
cloudapim_llm_output_tokens_per_second_by_model | bar | Generation speed |
cloudapim_llm_error_rate_over_time | line | Error rate |
cloudapim_llm_errors_by_kind / _top_error_messages | donut / bar | Status codes, exceptions, guardrail denials, open circuits |
cloudapim_llm_errors_by_provider / _error_rate_by_provider / _errors_by_model / _errors_by_route | bar | Where failures come from |
cloudapim_llm_recent_errors | table | The latest failures, with their error |
cloudapim_llm_guardrail_denials_total / _guardrail_denials_over_time | metric / area | Calls refused by guardrails |
cloudapim_llm_ratelimit_headroom_by_provider | bar | The providers closest to throttling you |
cloudapim_llm_providers_table | table | Calls, error rate, average and p95 latency per provider |
cloudapim_llm_provider_quota_alerts_total / _over_time / _by_provider | metric / area / donut | Provider quota incidents |
cloudapim_llm_provider_quota_refused_calls | metric | Calls refused while a provider was throttled or out of credit |
MCP
| Query | Widget | |
|---|---|---|
cloudapim_mcp_calls_total / _tool_calls_total | metric | MCP requests, tool calls |
cloudapim_mcp_errors_total / _error_rate | metric | Protocol, transport and tool failures |
cloudapim_mcp_latency_p95 | metric | Request duration |
cloudapim_mcp_calls_over_time / _error_rate_over_time | area / line | Traffic and failures |
cloudapim_mcp_by_method / _by_side / _by_transport / _by_protocol_version | donut / pie | How clients talk to your servers |
cloudapim_mcp_top_tools / _failing_tools / _slowest_tools | bar | Tool rankings |
cloudapim_mcp_calls_by_tool_over_time | line | One series per tool |
cloudapim_mcp_tools_table | table | Calls, failures, average and p95 latency per tool |
cloudapim_mcp_top_servers / _top_connectors / _failing_connectors | bar | Servers exposed, upstream servers consumed |
cloudapim_mcp_top_apikeys / _top_users | bar | Who uses MCP |
cloudapim_mcp_top_errors / _failing_resource_fetches | bar | What goes wrong |
cloudapim_mcp_latency_percentiles_over_time / _latency_heatmap | line / heatmap | Latency |
cloudapim_mcp_zero_trust_events_total / _zero_trust_blocked_total | metric | Zero-trust decisions |
cloudapim_mcp_zero_trust_over_time / _by_kind / _by_tool | area / donut / bar | Rug-pulls, guardrails and redactions, tool by tool |
Where the data lives
Three tables are created next to Otoroshi's own, and honour the exporter's retention settings:
| Table | Holds |
|---|---|
<table>_cloudapim_llm_usage | One row per LLM call: modality, provider, model, tokens, cost, ecological impacts, budgets, cache status, latency, error |
<table>_cloudapim_mcp_calls | One row per MCP request, served or sent through a connector: method, tool, transport, protocol version, connector, latency, failure |
<table>_cloudapim_ai_alerts | Budget warnings and overruns, provider quota incidents, MCP zero-trust events |
Each row carries the Otoroshi request_id, so a call can be joined with the gateway event of the
same request — and with the MCP tool calls it triggered.