Observability
Every interaction with a Large Language Model (LLM) generates crucial data that can be monitored, analyzed, and optimized.
Our LLM Gateway provides real-time tracking, security, and performance insights, acting as a centralized observability layer to streamline LLM interactions.
By routing all requests through our LLM gateway, you gain:
- Full-stack observability by capturing every LLM request before it reaches the provider
- Granular control over who can access what, when, and how
- Cost efficiency through detailed usage tracking and budgeting
- Real-time insights into token consumption, latency, and error rates
Key metrics tracked
Every LLM request logs critical telemetry data, including:
- LLM Provider - Identify the AI service in use (e.g., OpenAI, Anthropic, Mistral)
- Model Version - Track which model is processing requests
- Prompt & Response Data - Log inputs and outputs for debugging & quality control
- Token Usage Metrics - Measure input/output/reasoning token consumption
- User Identity - Associate API usage with specific users for accountability
- API Key Tracking - Monitor & secure API access to prevent unauthorized use
- Cost Tracking - Compute costs per request, per model, per user
- Ecological Impact - Estimate energy consumption and CO2 emissions
- Budget Consumption - Track spending against defined budget limits
Audit event types
The LLM extension emits several dedicated audit event types. They are standard Otoroshi AuditEvents and can be filtered by their audit field in data exporters:
audit type | Emitted for | Always on? | Reference |
|---|---|---|---|
LLMUsageAudit | Every LLM provider interaction (chat, completion, embedding, audio, image, moderation, video) | Yes | Reporting |
McpAudit | Calls to MCP servers Otoroshi exposes (server side) | Opt-in (emit_audit_events on the MCP server plugin) | MCP server exposition |
McpClientAudit | Calls Otoroshi makes to upstream MCP servers through a connector (client side) | Opt-in (audit_events on the MCP connector) | MCP connectors |
LLM-specific data is also added to the standard Otoroshi GatewayEvent (see Reporting — extra analytics data).
LLMUsageAudit, McpAudit and McpClientAudit all carry a request_id field (the Otoroshi request snowflake, also exposed as the GatewayEvent @id). Within a single request you can therefore correlate the chat completion (LLMUsageAudit), the MCP tool calls made to upstream servers (McpClientAudit), and any call served by an exposed MCP server (McpAudit) — all by joining on request_id.
Real-time MCP metrics
In addition to audit events, MCP calls feed Otoroshi's real-time metrics (exposed via Otoroshi's metrics endpoint — Prometheus / JSON export). Unlike audit events, metrics are always on when Otoroshi metrics are enabled — they do not require the emit_audit_events / audit_events opt-in flags (those only control the detailed audit events).
Metric names are flat, with the operation encoded in the name (Otoroshi's metric API carries no tags). The <op> / <method> segment is the MCP operation with / replaced by . (e.g. tools/call → tools.call).
Client side (calls Otoroshi makes to upstream MCP servers through a connector):
| Metric | Type | Description |
|---|---|---|
mcp.client.calls | counter | Total upstream MCP calls |
mcp.client.errors | counter | Total failed upstream MCP calls |
mcp.client.<op>.calls | counter | Calls for a given operation (e.g. mcp.client.tools.call.calls) |
mcp.client.<op>.errors | counter | Failed calls for a given operation |
mcp.client.<op>.duration | timer | Latency of a given operation |
Server side (calls external clients make to MCP servers Otoroshi exposes):
| Metric | Type | Description |
|---|---|---|
mcp.server.calls | counter | Total MCP method calls served |
mcp.server.errors | counter | Total failed MCP method calls |
mcp.server.<method>.calls | counter | Calls for a given method (e.g. mcp.server.tools.list.calls) |
mcp.server.<method>.errors | counter | Failed calls for a given method |
mcp.server.<method>.duration | timer | Latency of a given method |
These are standard Otoroshi metrics: scrape them from the Otoroshi metrics endpoint and build real-time dashboards (request rate, error rate, latency) without parsing audit events.
Real-time LLM metrics
Like MCP, every AI operation also feeds Otoroshi's real-time metrics under the ai.* namespace. They are always on when Otoroshi metrics are enabled — independent of any audit opt-in. Names are flat (the metric API carries no tags); the <op> segment is the operation, equal to the consumed_using value with / replaced by . (e.g. chat/completion/blocking → chat.completion.blocking). Covered operations: chat.completion.blocking|streaming, completion.blocking|streaming, embedding_model.embedding, audio_model.translate|stt|tts, image_model.generate|edit, moderation_model.moderate, video_model.generate, ocr.extract, search.query, embedding_store.add|search|remove.
Operations
| Metric | Type | Description |
|---|---|---|
ai.calls / ai.errors | counter | Total AI operations / failures (all operations) |
ai.<op>.calls / ai.<op>.errors | counter | Calls / failures for a given operation |
ai.<op>.duration | timer | Latency of a given operation (for streaming: time-to-stream-start) |
ai.provider.<kind>.calls / .errors | counter | Breakdown by provider kind (e.g. ai.provider.openai.calls) |
Volume (chat & embedding)
| Metric | Type | Description |
|---|---|---|
ai.tokens.prompt / ai.tokens.generation / ai.tokens.reasoning / ai.tokens.total | counter | Cumulative tokens consumed |
ai.cost.micro_usd | counter | Cumulative cost in micro-USD (1e-6 USD); precise accounting stays in LLMUsageAudit / budgets |
Cross-cutting
| Metric | Type | Description |
|---|---|---|
ai.cache.hit / ai.cache.miss (+ `ai.cache.[strategy].hit | miss`) | counter |
ai.guardrail.<outcome> (+ ai.guardrail.<kind>.<outcome>, ai.guardrail.calls) | counter | Guardrail outcomes (<outcome> = pass / deny / error, <kind> = regex, llm, prompt_injection, …) |
ai.fallback.calls | counter | Provider fallbacks triggered |
ai.circuit.open / ai.circuit.close | counter | Provider circuit-breaker transitions |
ai.budget.exceeded | counter | Requests blocked by a budget |
ai.model_constraint.denied | counter | Requests denied by model allow-listing |
Using data exporters
You can use Otoroshi data exporters to extract LLM usage information and send it to any external system (Elasticsearch, Kafka, webhooks, etc.).
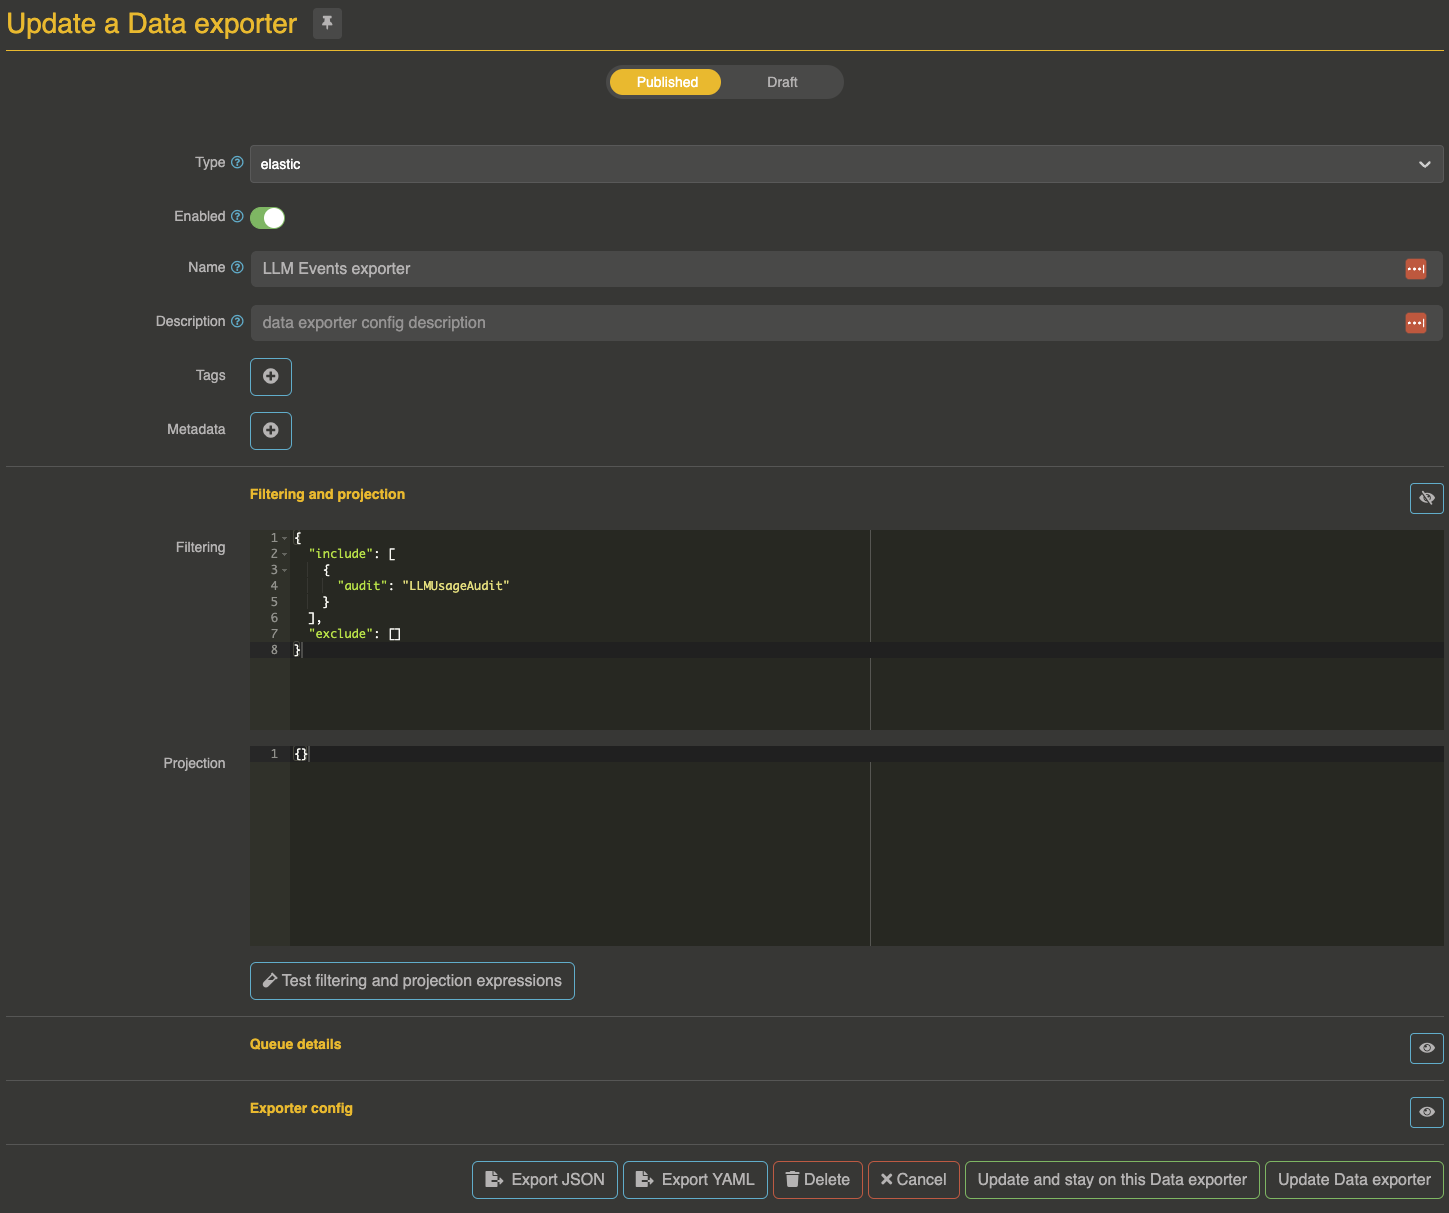
Make sure to filter events on LLMUsageAudit:
{
  "include": [{
    "audit": "LLMUsageAudit"
  }],
  "exclude": []
}
For detailed information about LLMUsageAudit events, event fields, operation types, and dashboard examples, see the Reporting documentation.
Dashboarding
You can use LLMUsageAudit events to build dashboards with tools like Kibana, Grafana, or any visualization tool.
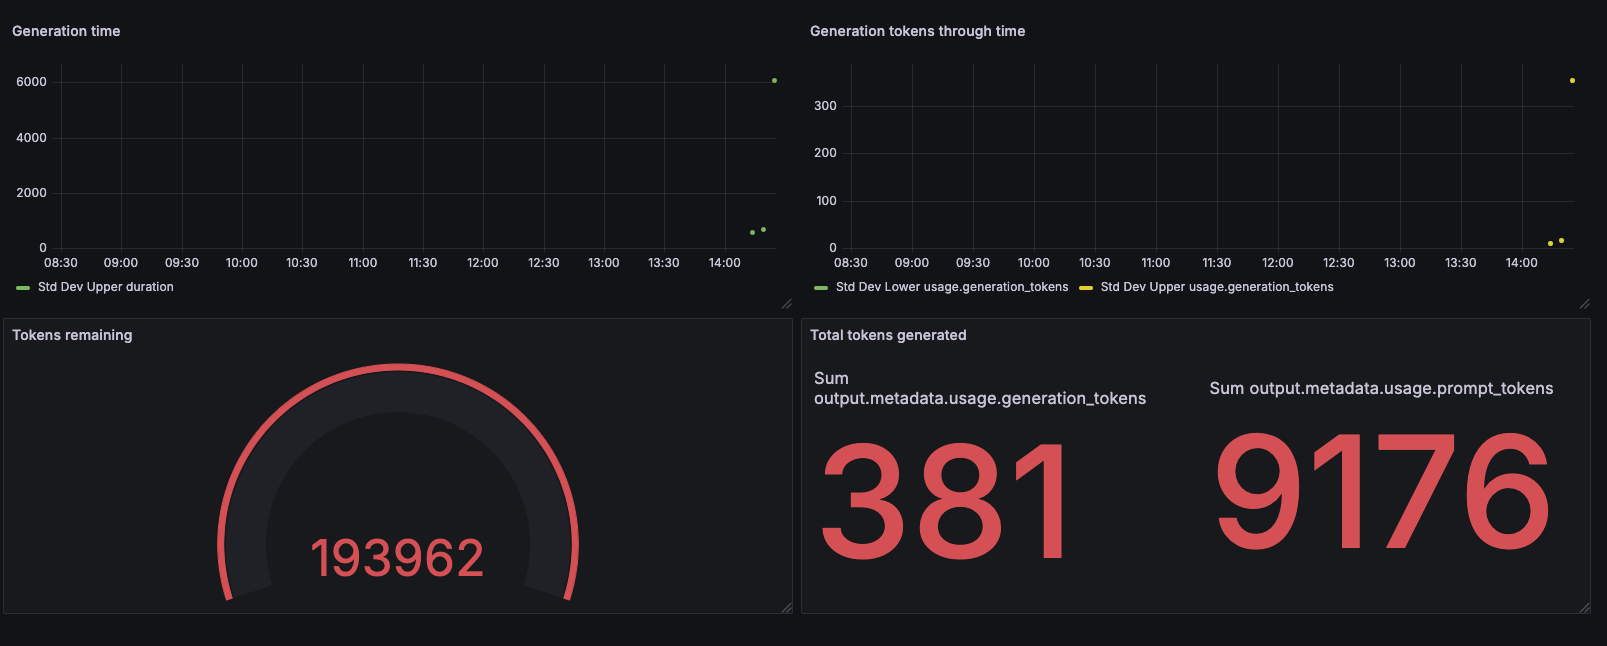
See the Reporting section for Elasticsearch data exporter configuration examples and event structure details.