Reporting
You can use the audit events generated by your LLM usage to make some reporting dashboard and follow your metrics in near real-time.
Every interaction with an LLM provider generates a LLMUsageAudit event that contains detailed information about the request, the response, the provider, the costs, the ecological impacts, the budgets, and more.
This page documents the LLMUsageAudit event. MCP usage is covered by two dedicated, opt-in audit events: McpAudit (MCP servers Otoroshi exposes) and McpClientAudit (upstream MCP servers Otoroshi calls through a connector). See the Observability overview for the full list.
Beyond audit events, every AI and MCP operation also feeds Otoroshi's always-on real-time metrics (ai.* / mcp.*, scrapable via Prometheus / JSON). See Observability — Real-time LLM metrics.
LLMUsageAudit event fields
| Field | Type | Description |
|---|---|---|
@id | string | Unique event identifier |
@timestamp | number | Event timestamp in milliseconds |
@type | string | Always "AuditEvent" |
@product | string | Always "otoroshi" |
audit | string | Always "LLMUsageAudit" |
request_id | string | null | The Otoroshi request id (snowflake) — same value as the GatewayEvent @id, and as the request_id of the McpAudit / McpClientAudit events emitted during the same request. Use it to correlate a chat completion with the MCP tool calls it triggered. |
provider_kind | string | The LLM provider type (e.g., openai, anthropic, mistral, etc.) |
provider | string | The provider entity ID |
duration | number | Request duration in milliseconds |
model | string | The model used for the request |
rate_limit | object | Rate limit information from the provider (requests_limit, requests_remaining, tokens_limit, tokens_remaining) |
usage | object | Token usage (prompt_tokens, generation_tokens, reasoning_tokens) |
error | object/null | Error details if the request failed, null on success |
consumed_using | string | The type of operation (see below) |
user | object/null | The authenticated user, if any |
apikey | object/null | The API key used, if any |
route | object/null | The Otoroshi route that handled the request |
input_prompt | array/object | The input prompt or request body |
output | object/array | The LLM response |
provider_details | object | Full provider configuration |
impacts | object/null | Ecological impact data (if enabled) |
costs | object/null | Cost tracking data (if enabled) |
budgets | object/null | Budget consumption data (if enabled) |
consumer_rate_limit | object/null | Consumer token rate limit information |
Operation types (consumed_using)
The consumed_using field indicates what kind of LLM operation generated the event:
| Value | Description |
|---|---|
chat/completion/blocking | Synchronous chat completion |
chat/completion/streaming | Streaming chat completion |
completion/blocking | Synchronous text completion |
completion/streaming | Streaming text completion |
embedding_model/embedding | Text embedding generation |
audio_model/translate | Audio translation |
audio_model/stt | Speech-to-text transcription |
image_model/generate | Image generation |
image_model/edit | Image editing |
moderation_model/moderate | Content moderation |
video_model/generate | Video generation |
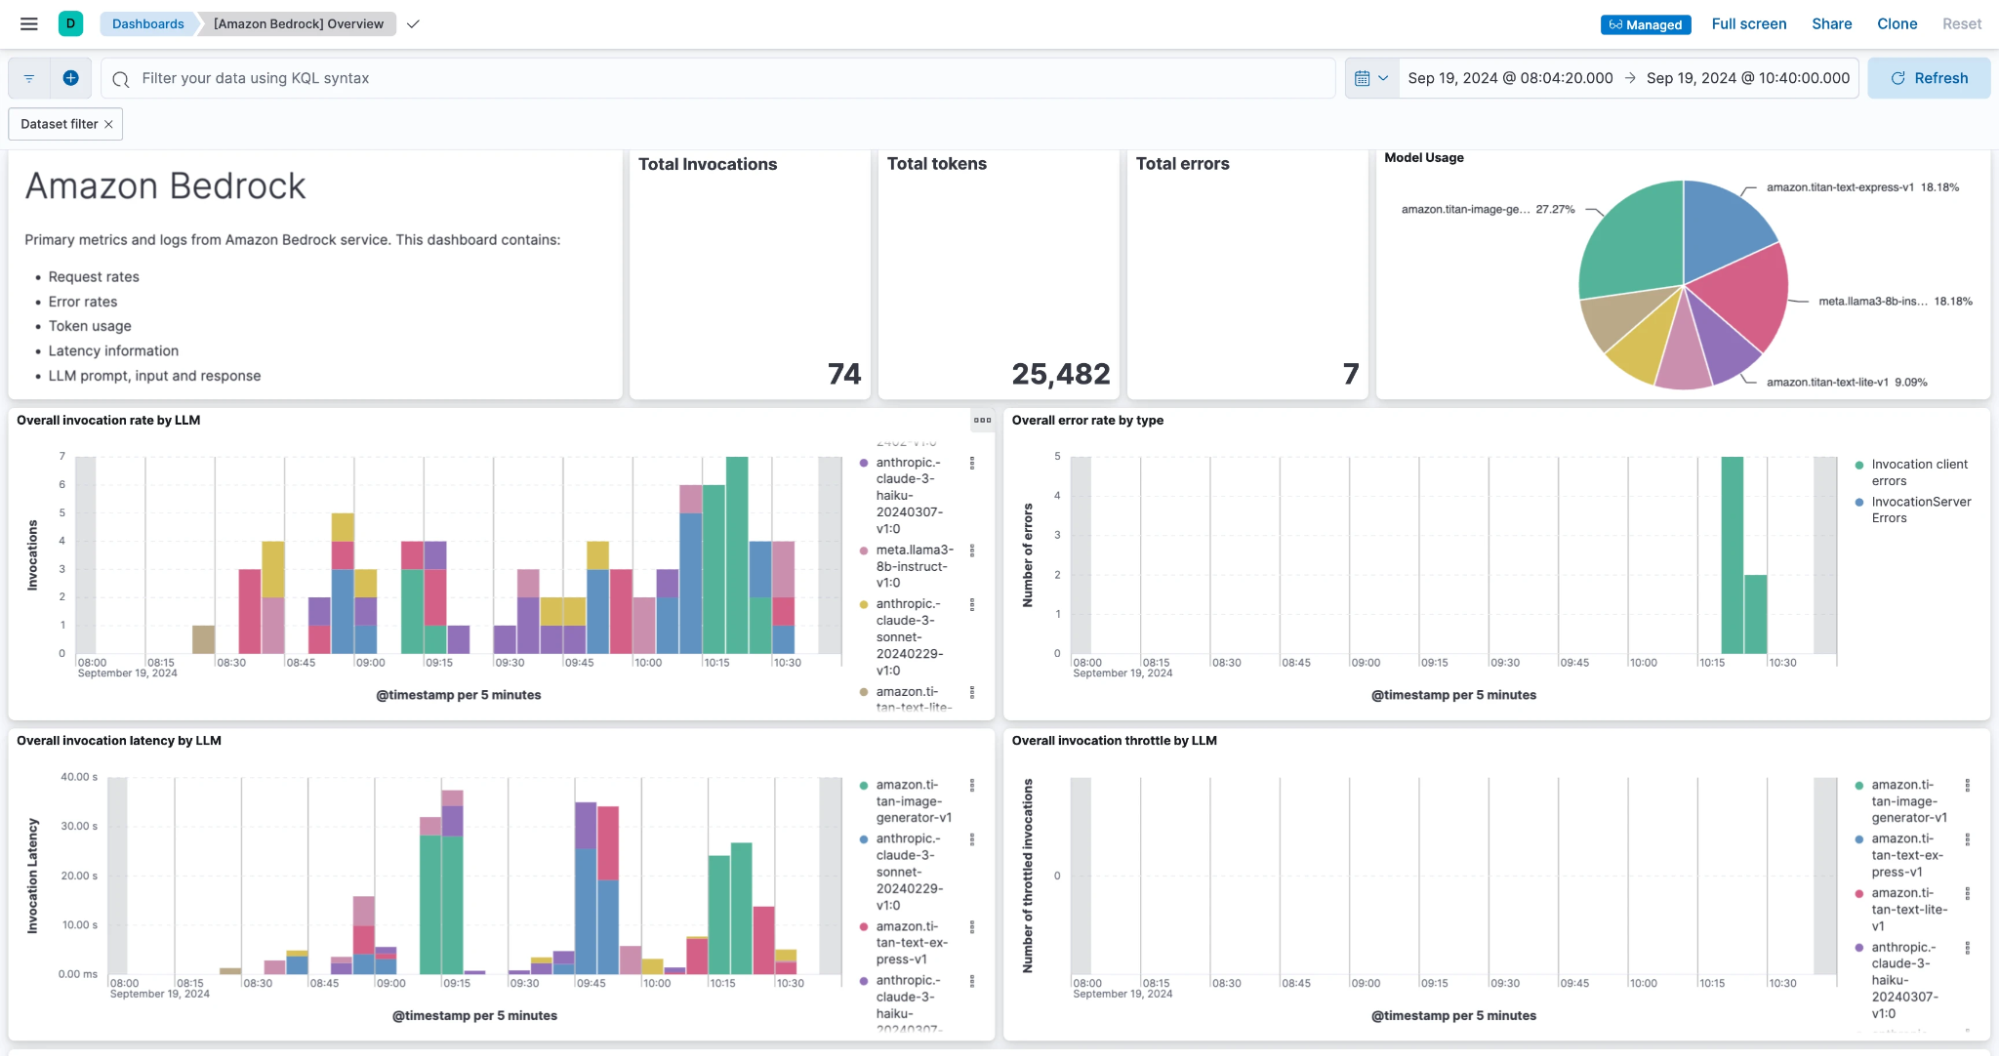
Dashboard example
In the following screenshot, we used an Elasticsearch data exporter to send
LLMUsageAudit events to an Elasticsearch instance and Kibana to create a dashboard based on those events.
Elastic data exporter example
Go to Data Exporters page and create a new one.
{
  "_loc": {
    "tenant": "default",
    "teams": [
      "default"
    ]
  },
  "type": "elastic",
  "enabled": true,
  "id": "data_exporter_be7a6e21-152b-4c09-b384-15f9dbb8041f",
  "name": "New elastic exporter config",
  "desc": "New elastic exporter config",
  "metadata": {},
  "tags": [],
  "bufferSize": 5000,
  "jsonWorkers": 1,
  "sendWorkers": 5,
  "groupSize": 100,
  "groupDuration": 30000,
  "projection": {},
  "filtering": {
    "include": [
      {
        "audit": "LLMUsageAudit"
      }
    ],
    "exclude": []
  },
  "config": {
    "clusterUri": "http://localhost:9200",
    "uris": [
      "http://localhost:9200"
    ],
    "index": "otoroshi-llm",
    "type": null,
    "user": null,
    "password": null,
    "headers": {},
    "indexSettings": {
      "clientSide": true,
      "interval": "Day",
      "numberOfShards": 1,
      "numberOfReplicas": 1
    },
    "mtlsConfig": {
      "certs": [],
      "trustedCerts": [],
      "mtls": false,
      "loose": false,
      "trustAll": false
    },
    "applyTemplate": true,
    "version": null,
    "maxBulkSize": 100,
    "sendWorkers": 4
  },
  "kind": "events.otoroshi.io/DataExporter"
}
Extra analytics data in GatewayEvent
In addition to the dedicated LLMUsageAudit events, the LLM extension also enriches the standard Otoroshi GatewayEvent (the analytics event generated for every HTTP request passing through a route) with LLM-specific data. This data is added to the ExtraAnalyticsData field of the GatewayEvent using different keys depending on the operation type.
Analytics data keys
| Key | Operation type | Added by |
|---|---|---|
ai | Chat completion, text completion | LLM providers (OpenAI, Anthropic, Mistral, etc.) |
ai-embedding | Embedding generation | Embedding model auditing decorator |
ai-audio | Audio translation, speech-to-text | Audio model auditing decorator |
ai-image | Image generation, image editing | Image model auditing decorator |
ai-moderation | Content moderation | Moderation model auditing decorator |
ai-video | Video generation | Video model auditing decorator |
ai-consumer-rate-limit | Token rate limiting | LLM Token Rate Limiting plugin |
Each key contains an array of objects, one per LLM call made during the request processing. This allows tracking multiple LLM calls within a single HTTP request (e.g., when using fallbacks or load balancing).
ai key structure (chat/completion)
For chat and text completion operations, each provider adds a slug to the ai array with the following fields:
| Field | Type | Description |
|---|---|---|
provider_kind | string | The provider type (e.g., "openai", "AzureOpenAi", "Anthropic") |
provider | string | The provider entity ID |
duration | number | Request duration in milliseconds |
model | string | The model used |
rate_limit | object | Rate limit information (requests_limit, requests_remaining, tokens_limit, tokens_remaining) |
usage | object | Token usage (prompt_tokens, generation_tokens, reasoning_tokens) |
cache | object | Cache information (if a cache hit occurred) |
deployment_id | string | Azure OpenAI deployment ID (Azure providers only) |
resource_name | string | Azure OpenAI resource name (Azure providers only) |
ai-consumer-rate-limit key structure
The LLM Token Rate Limiting plugin adds an ai-consumer-rate-limit array to the extra analytics data. Each entry in the array is appended during response or error transformation, with the following fields:
| Field | Type | Description |
|---|---|---|
max_tokens | number | Maximum allowed tokens in the window |
window_millis | number | Rate limit window duration in milliseconds |
consumed_tokens | number | Tokens consumed in the current window |
remaining_tokens | number | Remaining tokens in the current window |
ai-embedding key structure
| Field | Type | Description |
|---|---|---|
provider_kind | string | The provider type |
provider | string | The provider entity ID |
duration | number | Request duration in milliseconds |
| + response fields | The full embedding response (model, usage, data) |
ai-audio key structure
| Field | Type | Description |
|---|---|---|
provider_kind | string | The provider type |
provider | string | The provider entity ID |
duration | number | Request duration in milliseconds |
| + response fields | The full audio response (text, language, duration, segments) |
ai-image key structure
| Field | Type | Description |
|---|---|---|
provider_kind | string | The provider type |
provider | string | The provider entity ID |
duration | number | Request duration in milliseconds |
| + response fields | The full image response (created, data) |
ai-moderation key structure
| Field | Type | Description |
|---|---|---|
provider_kind | string | The provider type |
provider | string | The provider entity ID |
duration | number | Request duration in milliseconds |
| + response fields | The full moderation response (id, model, results) |
ai-video key structure
| Field | Type | Description |
|---|---|---|
provider_kind | string | The provider type |
provider | string | The provider entity ID |
duration | number | Request duration in milliseconds |
| + response fields | The full video response |
Example GatewayEvent extra analytics data
{
  "ai": [
    {
      "provider_kind": "openai",
      "provider": "provider_10bbc76d-7cd8-4cb7-b760-61e749a1b691",
      "duration": 415,
      "model": "gpt-4o-mini",
      "rate_limit": {
        "requests_limit": 10000,
        "requests_remaining": 9999,
        "tokens_limit": 200000,
        "tokens_remaining": 199993
      },
      "usage": {
        "prompt_tokens": 11,
        "generation_tokens": 18,
        "reasoning_tokens": 0
      }
    }
  ],
  "ai-consumer-rate-limit": [
    {
      "max_tokens": 1000,
      "window_millis": 60000,
      "consumed_tokens": 29,
      "remaining_tokens": 971
    }
  ]
}
LLMUsageAudit event example
Here is a full example of a LLMUsageAudit event for a chat completion request:
{
  "@id": "1905616593920983819",
  "@timestamp": 1743169375292,
  "@type": "AuditEvent",
  "@product": "otoroshi",
  "@serviceId": "",
  "@service": "Otoroshi",
  "@env": "dev",
  "audit": "LLMUsageAudit",
  "request_id": "1905616593920983819",
  "provider_kind": "openai",
  "provider": "provider_10bbc76d-7cd8-4cb7-b760-61e749a1b691",
  "duration": 415,
  "model": "gpt-4o-mini",
  "rate_limit": {
    "requests_limit": 10000,
    "requests_remaining": 9999,
    "tokens_limit": 200000,
    "tokens_remaining": 199993
  },
  "usage": {
    "prompt_tokens": 11,
    "generation_tokens": 18,
    "reasoning_tokens": 0
  },
  "error": null,
  "consumed_using": "chat/completion/blocking",
  "user": null,
  "apikey": null,
  "route": {
    "id": "route_e4a9d6cb3-d859-4203-a860-8d1dd6d09557",
    "name": "test",
    "..."
  },
  "input_prompt": [
    {
      "role": "user",
      "content": "tell me a joke"
    }
  ],
  "output": {
    "generations": [
      {
        "message": {
          "role": "assistant",
          "content": "Why did the scarecrow win an award?\n\nBecause he was outstanding in his field!"
        }
      }
    ],
    "metadata": {
      "rate_limit": { "..." },
      "usage": { "..." },
      "costs": {
        "input_cost": 0.00000165,
        "output_cost": 0.0000108,
        "reasoning_cost": 0,
        "total_cost": 0.00001245,
        "currency": "dollar"
      }
    }
  },
  "provider_details": {
    "id": "provider_10bbc76d-7cd8-4cb7-b760-61e749a1b691",
    "name": "OpenAI",
    "provider": "openai",
    "..."
  },
  "impacts": null,
  "costs": {
    "input_cost": 0.00000165,
    "output_cost": 0.0000108,
    "reasoning_cost": 0,
    "total_cost": 0.00001245,
    "currency": "dollar"
  },
  "budgets": null,
  "consumer_rate_limit": null
}